Fig. 4
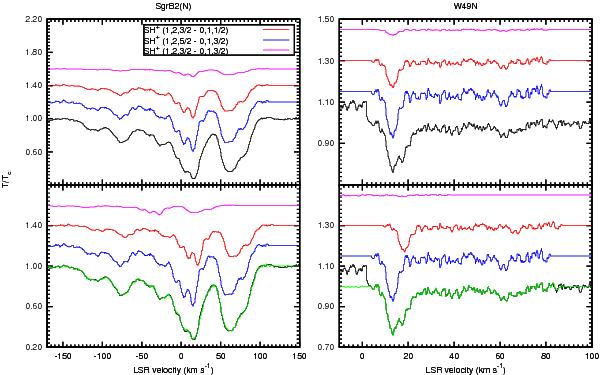
Result of the hyperfine structure deconvolution code applied on the SH+ (1,2 ← 0,1) absorption spectrum observed towards SgrB2(N) and W49N. The top panel displays the original data (black) and the resulting decomposition in three hyperfine components, aligned to the same velocity scale. The hyperfine components are shifted by their velocity shift Δυh (see Table 2) in the bottom panels, to show how they can be combined (green line) to reproduce the original data (black line). For more clarity, the hyperfine components were vertically shifted from the original data.
Current usage metrics show cumulative count of Article Views (full-text article views including HTML views, PDF and ePub downloads, according to the available data) and Abstracts Views on Vision4Press platform.
Data correspond to usage on the plateform after 2015. The current usage metrics is available 48-96 hours after online publication and is updated daily on week days.
Initial download of the metrics may take a while.