Fig. 3
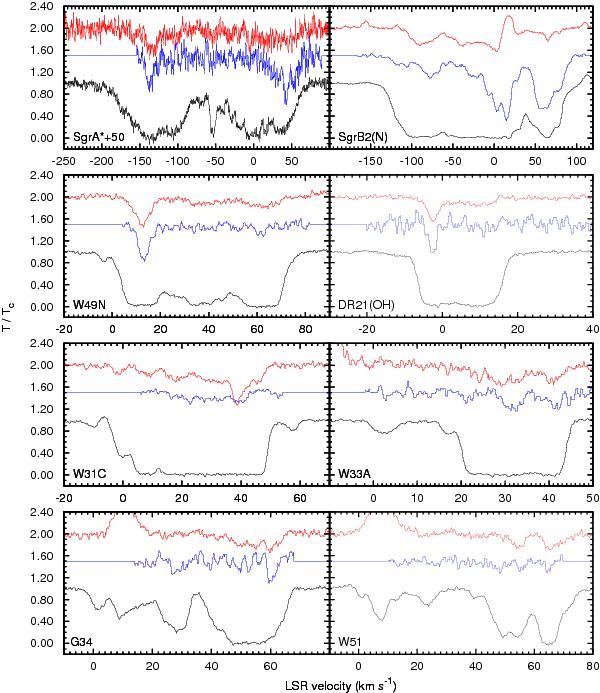
Absorption profiles observed in the direction of DR21(OH), G34.3+0.1, W31C, W33A, W49N, W51, SgrA*+50, and SgrB2(N) in the ground-state transitions of CH+ (black) and 13CH+ (red), and in the main hyperfine component (see Table 2) of the ground-state transition of SH+ (blue). All spectra have been normalized to the continuum temperatures. To make the absorption features discernible, the 13CH+ and SH+ signals were mutiplied by a factor of 2 towards SgrA*+50, and SgrB2(N), and by factors of 2 and 3, respectively, towards the other sources. For more clarity the 13CH+ and SH+ spectra were shifted from the CH+ spectra by 0.5 and 1.0. The x- and y- scales were chosen to display the velocity structure of the absorption features in detail.
Current usage metrics show cumulative count of Article Views (full-text article views including HTML views, PDF and ePub downloads, according to the available data) and Abstracts Views on Vision4Press platform.
Data correspond to usage on the plateform after 2015. The current usage metrics is available 48-96 hours after online publication and is updated daily on week days.
Initial download of the metrics may take a while.