| Issue |
A&A
Volume 540, April 2012
|
|
|---|---|---|
| Article Number | A68 | |
| Number of page(s) | 6 | |
| Section | Stellar structure and evolution | |
| DOI | https://doi.org/10.1051/0004-6361/201117408 | |
| Published online | 27 March 2012 | |
Research Note
Detection of multiple modes in a new double-mode RR Lyrae star⋆
Université Nice Sophia-Antipolis, Observatoire de la Côte d’Azur, UMR 7293, Parc Valrose, 06108 Nice Cedex 02, France
Antarctica Reaserch Station, South Pole, TAAF, Antarctica
e-mail: This email address is being protected from spambots. You need JavaScript enabled to view it.
Received: 4 June 2011
Accepted: 7 February 2012
Abstract
Context. We present the first long-time coverage of high precision and uninterrupted light curve of a new double-mode RR Lyrae star allowing the determination of accurate Fourier components and the estimatation of fundamental parameters.
Aims. We used high-precision space data of a new star CoRoT ID 0101368812, obtained by the satellite CoRoT, towards an understanding of double-mode RR Lyrae stars and the stellar evolution & pulsation.
Methods. The CoRoT data were corrected using jump and trend filtering codes and we applied the period-finding technique Period04.
Results. Non-linearly coupled frequencies f0 = 2.049 d-1 (P0 = 0.488 d) and f1 = 2.750 d-1 (P1 = 0.364 d) are found up to the tenth order with a period ratio P1/P0 of 0.745 and an amplitude ratio A1/A0 of 2.705. The frequencies f0 and f1 are interpreted as radial modes. The first overtone is the dominant pulsation mode. A large number of 22 linear combinations of these modes are also detected. An unprecedented number of additional frequencies and their linear combinations, are detected in addition to the fundamental radial mode, the first overtone radial mode, and their linear combinations. The most surprising result is the unexpected period ratios 0.458, 0.285, and 0.217 of additional frequencies to fundamental radial mode, which imply a possible simultaneous excitation of fundamental, first, and third overtone radial modes, in addition to non-radial modes.
Conclusions. The newly discovered CoRoT ID 0101368812 is the first member of a new class of RR Lyrae stars. These results give us an opportunity to test the theoretical models of mode saturation and growth in RR d pulsators.
Key words: hydrodynamics / shock waves / techniques: photometric / stars: atmospheres / stars: variables: RR Lyrae / stars: Population II
Table 3 is available in electronic form at http://www.aanda.org
© ESO, 2012
1. Introduction
Double-mode RR Lyrae stars, namely RR d, pulsate simultaneously in the first overtone and fundamental radial modes (Nemec 1984). Their period ratio ranges from about 0.74 to 0.75 and the first overtone radial mode is usually dominant (Oaster et al. 2006).
The RR d stars play a key role in the mass determinations based on the period ratio independently of stellar evolution theory (Smith 1995). They have been identified in the Galactic field, the Magellanic Clouds, globular clusters, and dwarf spheroidal galaxies (Clement et al. 1991). The RR d stars have been studied spectroscopically and photometrically by Clement et al. (1991), Clementini et al. (2000), and Dekany et al. (2008), focusing on AQ Leo, CU Com, and BS Com.
Using MOST optical photometry of the RR d star AQ Leo, Gruberbauer et al. (2007) reported that AQ Leo (P1 = 0.410 d, P0 = 0.550 d, and P1/P0 of 0.745) oscillates with additional frequencies besides the fundamental radial mode, the first overtone radial mode and their linear combinations. They suggested that there are two possibly additional non-radial pulsation modes. Dekany et al. (2008) derived the basic physical parameters of RR d star BS Com (P1 = 0.363 d, P0 = 0.488 d, and P1/P0 of 0.744) by using evolutionary models and ground-based photometric observations. They did not detect additional frequencies in the BS Com Fourier spectrum.
The nature of the additional frequencies in RR d stars, as well as in Blazhko stars (Chadid et al. 2010), needs further investigation. The continuous and unprecedented CoRoT photometric data provide a unique opportunity to obtain an RR d light curve over relatively long time period (150 days) and with a relatively high precision.
In this paper, we discuss the discovery of a new double-mode RR Lyrae star, CoRoT ID 0101368812, which exhibits additional frequency terms. The star CoRoT ID 0101368812 (α = 19 28 13.645, δ = +00 40 42.83, V = 15.60 mag) was observed during the first long run in the center direction of the Galaxy LRc01, from May 16th to October 15th, 2007.
Section 2 describes the CoRoT data reduction. Section 3 is devoted to the description of data analysis with our findings. The fundamental parameters are presented in Sect. 4. Finally, some concluding remarks are given in Sect. 5.
2. Observations and data reduction
We used the CoRoT data of the target CoRoT ID 0101368812, which is a new RR Lyrae star observed during the first long run targeting the Galactic center (LRc01). The CoRoT data are the calibrated light curves, N2-level, and we used here the resulting “white” flux. The total time span is 152 days (Fig. 1). The time sampling of the light curves is 512 s, giving a time resolution of 1.2% of the pulsation fundamental period. The CoRoT N2 data are affected by jumps, trends, and a long-term drift in the light curves owing to changes in the amount of incident stray light during the run, periodic changes in flux caused by the satellite orbit, and discontinuities in the light curves caused by cosmic ray hits on the CCDs. Thus, a trend-and-jump filtering code was applied to the data. The trend-filtering process divides the data set into bins, and within each bin the fluxes and times are averaged. The independently binned, average values of fluxes are interpolated between the original points of time and subtracted from the observed ones. The jump filtering process is based on the difference between these values and the subsequent points of the light curve. A difference is regarded as a jump if it exceeds a certain faraction of the standard deviation (Chadid et al. 2010).
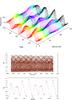 |
Fig. 1 Top panel: two-dimensional data folded with the period 1.426 d. Middle panel: the entire time series. Bottom panel: an expanded view of the light curve. |
3. Frequency analysis
The frequency analysis was performed using Period04 (Lenz & Breger 2005). The Fourier decomposition consists of fitting the magnitude measurements by means of the series ![Mathematical equation: \begin{equation} m(t)=A_0 + \sum_{i=1,N} A_{i}\sin[2\pi (F_i(t-T_0)+ \phi_i)], \end{equation}](/articles/aa/full_html/2012/04/aa17408-11/aa17408-11-eq21.png) (1)where T0 = 2691.75315 is the initial epoch value of the data set CoRoTJD. To check our frequency solution, we ran the program package SigSpec, which calculates the spectral significance sig defined by Reegen (2007) for each peak of the spectrum. Forty-nine significant frequencies are clearly detected with a threshold value of sig = 5 (Table 3). However, the regular behavior of harmonics in RR Lyrae stars helps us to identify frequency peaks, which are intrinsic to the star’s pulsation, of a lower amplitude than the accepted value. By means of a rigorous check of the high-frequency region, where the noise level is lower, we were able to detect the harmonics below the generally accepted significance level. Our data set for CoRoT ID 0101368812 consists of 415 consecutive pulsation cycles (Fig. 1).
(1)where T0 = 2691.75315 is the initial epoch value of the data set CoRoTJD. To check our frequency solution, we ran the program package SigSpec, which calculates the spectral significance sig defined by Reegen (2007) for each peak of the spectrum. Forty-nine significant frequencies are clearly detected with a threshold value of sig = 5 (Table 3). However, the regular behavior of harmonics in RR Lyrae stars helps us to identify frequency peaks, which are intrinsic to the star’s pulsation, of a lower amplitude than the accepted value. By means of a rigorous check of the high-frequency region, where the noise level is lower, we were able to detect the harmonics below the generally accepted significance level. Our data set for CoRoT ID 0101368812 consists of 415 consecutive pulsation cycles (Fig. 1).
3.1. Fundamental and first overtone radial modes
Figure 3 shows the amplitude spectrum of CoRoT ID 0101368812. We clearly observe two dominant frequencies f0 = 2.049009 ± 0.000005 d-1 (P0 = 0.4880408 ± 0.0000001 d), and f1 = 2.750263 ± 0.000002 d-1 (P1 = 0.3636016 ± 0.0000003 d). The period ratio P1/P0 = 0.7450229 corresponds to the period ratio of RRd in the Petersen diagram (Petersen 1973). We detect the harmonics of the fundamental radial mode f0 up to third order and those of the first overtone radial mode f1 up to tenth order. The amplitude ratio A1/A0 of 2.7054968 shows that the first overtone is the dominant pulsation mode and characterized by stronger non-linear behaviour which can be seen by the more pronounced non-sinusoidal shape of its light curve in Fig. 2.
Twenty-two linear combinations of frequency components of the fundamental and first overtone modes are detected. Their amplitudes are smaller than those of their constituent frequencies. The frequency terms of the positive linear combinations have larger amplitudes than those of the negative linear combinations. This seems to agree with the double-mode Cepheid models (Antonello & Aikawa 1998).
3.2. Additional frequencies
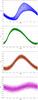 |
Fig. 2 Folded light curve of CoRoT ID 0101368812. From the upper to lower panel: a) folded with P1; b) prewhitened with P0 and folded with P1; c) prewhitened with P1 and folded with P0; d) folded with P2 after removal of P0, and P1, combination frequencies, and the additional frequencies P3 and P4. |
A detailed analysis reveals that the power spectrum has a complex structure in the frequency domain around f0 and f1. After prewhitening of the dominant radial frequency f1 and its harmonics, we see many additional peaks in the Fourier spectrum. Figure 3 shows the residual spectrum after prewhitening of the dominant frequency f1 and its harmonics. We clearly detect three independent frequencies:
-
f2 = 4.479 d-1: The frequency f2 = 4.4786159 ± 0.000002 d-1 (P2 = 0.2232832 ± 0.0000004 d) has an amplitude that is smaller than 3f1 and at the same level as that of the 2f0 harmonic. It occurs between f1 and its first harmonic and appears at a frequency ratio f1/f2 of 0.6140875. The frequency f2 has a period ratio P2/P0 of 0.4575094 and an amplitude ration A2/A0 of 0.1044413.
-
f3 = 7.194 d-1: Occurring between second and third harmonics of f1, the frequency f3 = 7.1943909 ± 0.000002 d-1 (P3 = 0.1389971 ± 0.0000004 d) has smaller amplitude than the 4f1 and 2f0 harmonics, with a frequency ratio f1/f3 of 0.3822782. We measure a period ratio P3/P0 of 0.2848064 and an amplitude ratio of A3/A0 of 0.0319339.
-
f4 = 9.433 d-1: The amplitude of f4 = 9.4325280 ± 0.000002 d-1 (P4 = 0.1060161 ± 0.0000006 d) is smaller than 2f0 and at the same level of that of the 7f1 harmonic. It appears between the third and fourth harmonics of the dominant mode f1, showing a frequency ratio f1/f4 of 0.2915721, a period ratio P4/P0 of 0.2172279, and an amplitude ration A4/A0 of 0.0151979.
Table 1 gives the relevant values of period and amplitude ratios. The frequencies f2, f3, and f4 consist of linear combinations of the fundamental and the first overtone radial modes and their harmonics. All the detected coupling terms of the positive linear combinations have larger amplitudes than those of the negative linear combinations (see Table 3). The origin of the additional frequencies f2, f3, and f4 is a great challenge. Judging from the period ratio alone, the ratio P2/P0 = 0.458 is very close to that of the third overtone to fundamental radial mode. Thus the frequency f2 = 4.479 d-1 is likely related to the third radial overtone mode. A similar case was reported for the star AQ Leo, for which a frequency fii = 3.92593 d-1 was detected by the MOST satellite (Gruberbauer et al. 2007): this implies a ratio to the fundamental radial mode (1.81896/3.92593 = 0.463), which is perhaps related to the third radial overtone mode. This strengthens our argument for the detection reliability of the third radial-overtone mode pulsation. On the other hand, the period ratio of f2 to the dominant first radial overtone mode f1 is 0.614. Such an unexpected period ratio of 0.61 was reported for RR Lyrae variables in the globular clusters ω Cen, V 19, and V 105 (Olech & Moskalik 2009) and in the LMC first overtone Cepheids (Moskalik & Kolaczkowski 2008; Soszynski et al. 2008). Both cases were theoretically interpreted as non-radial modes (Dziembowski & Smolec 2009). Hence, f2 = 4.479 d-1 may also be interpreted as a non-radial mode.
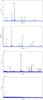
Fig. 3 From the upper to lower panels: a) the amplitude spectrum of the CoRoT ID 0101368812 light curve; b) the amplitude spectrum after prewhitening of the first overtone radial frequency and its harmonics; c) after prewhitening of the first overtone and the fundamental radial frequencies and their harmonics and their linear combination terms; and d) the residuals after prewhitening with all frequencies in Table 3. The dashed curve shows the noise level that corresponds to the level of the weakest amplitude in the data.
The additional frequencies f3 (f3 − 7/2f0 = 0.0225 d-1) may be the seventh half-integer frequency of the fundamental radial mode f0. Following this hypothesis, the presence of a half-integer frequency would be a clear sign of a period-doubling bifurcation in CoRoT ID 0101368812, as reported by Buchler & Moskalik (1992) in Pop II Cepheids. The analysis of the limit cycle stability (Moskalik & Buchler 1990) showed that 5:2 resonances, between the fundamental mode and a high-order radial overtone, are responsible for this instability in Pop II, that there is a coincidence between the period doubling and the resonance center, and then every half-integer resonance is able to cause period doubling. However, no clear sign of period doubling is detected in CoRoT ID 0101368812.
According to their unexpected period ratios P3/P0 = 0.285 and P4/P0 = 0.217, the frequencies f3 and f4 cannot be explained by any two radial modes and must be interpreted as non-radial modes (Dziembowski & Smolec 2009). Moreover, when we compare their period ratios with an estimated effective temperature (see Sect. 4) of 6500 − 7000 K, in Fig. 3 of Kollath et al. (2011), the frequency f3 = 7.194 d-1 is located half-way between the sixth and seventh overtones and the frequency f4 = 9.433 d-1 is half-way between the eight and ninth overtones, which excludes them from being radial modes.
Summary of the relevant data for CoRoT ID 0101368812.
4. Fundamental parameters of CoRoT ID 0101368812
The position of CoRoT ID 0101368812 in the Petersen diagram of Chadid et al. (2010), indicates that it has a very low metallicity and that its observed period ratio of P1/P0 = 0.745 and period of P0 = 0.488 are approximately equal to those of RRd stars. Comparing the period ratio and the fundamental period of CoRoT ID 0101368812 to the results of Szabo et al. (2004), our values match the sequence with M = 0.65−0.71 M⊙, L = 40−50 L⊙, and Teff = 6500−7000 K. The mean surface gravities are also calculated, by using Eq. (15) of Jurcsik (1998), which depends only on the fundamental period (Eq. (2)). We deduce a value of log g of around 2.855,  (2)Table 2 compares the fundamental parameters of both BS Com and CoRoT ID 0101368812 and indicates a close similarity of our results with those of Dekany et al. (2008) for the RR d star, BS Com, which has a fundamental period (0.4879) and a period ratio (0.744) that are almost equal to those of CoRoT ID 0101368812.
5. Summary
Continuous CoRoT photometry of a new CoRoT ID 0101368812 spanning over 152 days, with high time resolution
and high photometric precision, provides: (1) an accurate Fourier analysis of a new double mode RR Lyrae star; (2) non-linearly coupled frequencies, and both fundamental and first overtone radial modes f0 and f1, where the first overtone is the dominant pulsation mode (up to the tenth order); (3) a large number of 22 linear combinations of these modes; (4) additional frequencies f2, f3, and f4, that have never been seen before in double-mode RR Lyrae stars, which have unexpected period ratios of P2/P0 = 0.458 implying that f2 may be either the third radial overtone mode or a non-radial mode, and P3/P0 = 0.285 and P4/P0 = 0.217 implying that f3 and f4 must be non-radial- modes. The additional frequencies consist of 14 linear combinations with the fundamental and the first overtone radial modes and their harmonics. All the detected coupling terms of positive linear combinations have larger amplitudes than those of negative linear combinations.
These results imply that the newly discovered star CoRoT ID 0101368812 constitutes a new type of RR Lyrae pulsators and its data contributes to theoretical debates on the simultaneous excitation of the non-consecutive multi-overtone radial modes and the non-radial modes in RR Lyrae stars.
Online material
Acknowledgments
I thank Lee Murphy for a critical reading of the paper. During this work, I learned of the death of my friend Bernard Reyboz, the sculptor of Moving Objects in Space. This paper is dedicated to his memory.
References
- Antonello, E., & Aikawa, T. 1998, A&A, 337, 145 [NASA ADS] [Google Scholar]
- Buchler, J. R., & Moskalik, P. 1992, ApJ, 391, 736 [NASA ADS] [CrossRef] [Google Scholar]
- Chadid, M., Benko, J. M., Szabo, R., et al. 2010, A&A, 510, A39 [NASA ADS] [CrossRef] [EDP Sciences] [Google Scholar]
- Chadid, M., Perini, C., Bono, G., et al. 2011, A&A, 527, A146 [NASA ADS] [CrossRef] [EDP Sciences] [Google Scholar]
- Clement, C. M., Kinman, T. D., & Suntzeff, N. B. 1991, ApJ, 372, 273 [NASA ADS] [CrossRef] [Google Scholar]
- Clementini, G., Di Tomaso, S., Di Fabrizio, L., et al. 2000, AJ, 120, 2054 [NASA ADS] [CrossRef] [Google Scholar]
- Dekany, I., Kovacs, G., Jurcsik, J., et al. 2008, MNRAS, 386, 1 [Google Scholar]
- Dziembowski, W. A., & Smolec, R. 2009, AIPC, 1170, 83 [NASA ADS] [Google Scholar]
- Gruberbauer, M., Kolenberg, K., Rowe, J. F., et al. 2007, MNRAS, 379, 1498 [NASA ADS] [CrossRef] [Google Scholar]
- Jurcsik, J. 1998, A&A, 333, 571 [NASA ADS] [Google Scholar]
- Kollath, Z., Molnar, L., & Szabo, R. 2011, MNRAS, 414, 1111 [NASA ADS] [CrossRef] [Google Scholar]
- Lenz, P., & Breger, M. 2005, CoAst, 146, 53 [Google Scholar]
- Moskalik, P., & Buchler, J. R. 1990, ApJ, 355, 590 [NASA ADS] [CrossRef] [Google Scholar]
- Moskalik, P., & Kolaczkowski, Z. 2008, CoAst, 157, 343 [NASA ADS] [Google Scholar]
- Nemec, J. M. 1984, IAUS, 105, 465 [NASA ADS] [Google Scholar]
- Oaster, L., Smith, H. A., & Kinemuchi, K. 2006, PASP, 841, 405 [NASA ADS] [CrossRef] [Google Scholar]
- Olech, A., & Moskalik 2009, A&A, 494, 170 [CrossRef] [EDP Sciences] [Google Scholar]
- Petersen, J. O. 1973, A&A, 27, 89 [NASA ADS] [Google Scholar]
- Reegen, P. 2007, A&A, 467, 1353 [NASA ADS] [CrossRef] [EDP Sciences] [Google Scholar]
- Smith, H. A. 1995, RR Lyrae Stars (Cambridge: Cambridge Univ. Press) [Google Scholar]
- Soszynski, I., Poleski, R., Udalski, A., et al. 2008, Acta Astron., 58, 163 [NASA ADS] [Google Scholar]
- Szabo, R., Kollath, Z., & Buchler, R. 2004, A&A, 425, 627 [NASA ADS] [CrossRef] [EDP Sciences] [Google Scholar]
All Tables
All Figures
|
Fig. 1 Top panel: two-dimensional data folded with the period 1.426 d. Middle panel: the entire time series. Bottom panel: an expanded view of the light curve. |
| In the text | |
|
Fig. 2 Folded light curve of CoRoT ID 0101368812. From the upper to lower panel: a) folded with P1; b) prewhitened with P0 and folded with P1; c) prewhitened with P1 and folded with P0; d) folded with P2 after removal of P0, and P1, combination frequencies, and the additional frequencies P3 and P4. |
| In the text | |
|
Fig. 3 From the upper to lower panels: a) the amplitude spectrum of the CoRoT ID 0101368812 light curve; b) the amplitude spectrum after prewhitening of the first overtone radial frequency and its harmonics; c) after prewhitening of the first overtone and the fundamental radial frequencies and their harmonics and their linear combination terms; and d) the residuals after prewhitening with all frequencies in Table 3. The dashed curve shows the noise level that corresponds to the level of the weakest amplitude in the data. |
| In the text | |
Current usage metrics show cumulative count of Article Views (full-text article views including HTML views, PDF and ePub downloads, according to the available data) and Abstracts Views on Vision4Press platform.
Data correspond to usage on the plateform after 2015. The current usage metrics is available 48-96 hours after online publication and is updated daily on week days.
Initial download of the metrics may take a while.