Fig. 3
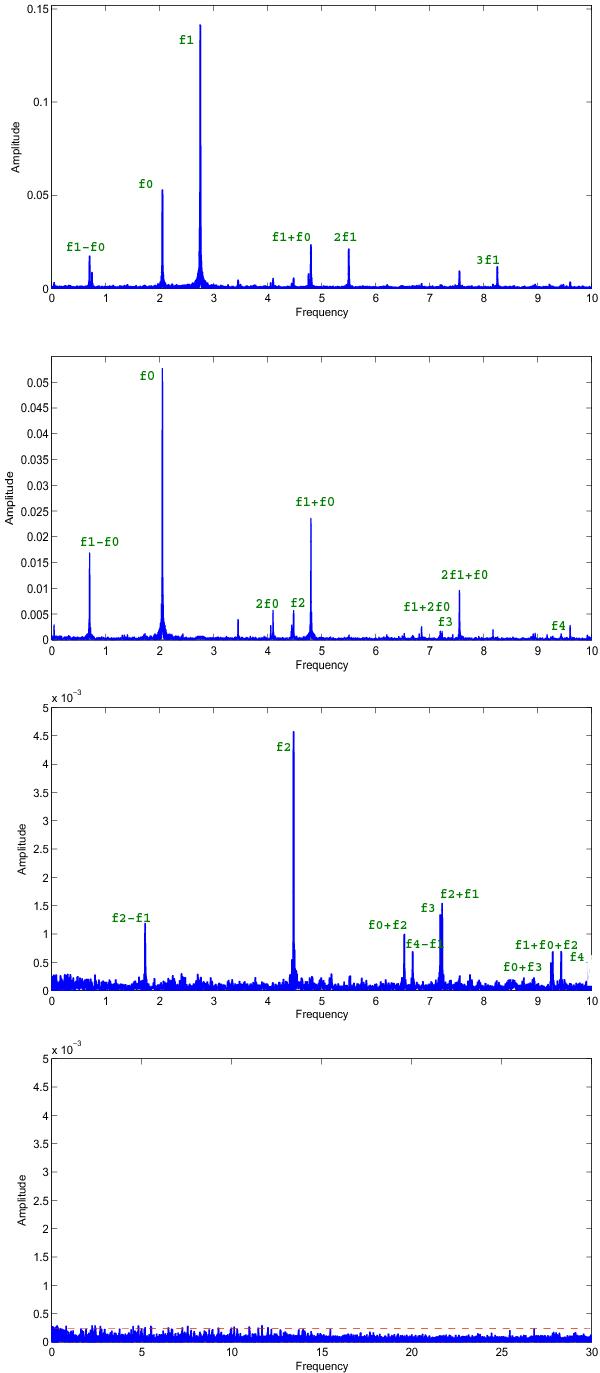
From the upper to lower panels: a) the amplitude spectrum of the CoRoT ID 0101368812 light curve; b) the amplitude spectrum after prewhitening of the first overtone radial frequency and its harmonics; c) after prewhitening of the first overtone and the fundamental radial frequencies and their harmonics and their linear combination terms; and d) the residuals after prewhitening with all frequencies in Table 3. The dashed curve shows the noise level that corresponds to the level of the weakest amplitude in the data.
Current usage metrics show cumulative count of Article Views (full-text article views including HTML views, PDF and ePub downloads, according to the available data) and Abstracts Views on Vision4Press platform.
Data correspond to usage on the plateform after 2015. The current usage metrics is available 48-96 hours after online publication and is updated daily on week days.
Initial download of the metrics may take a while.