Fig. 10
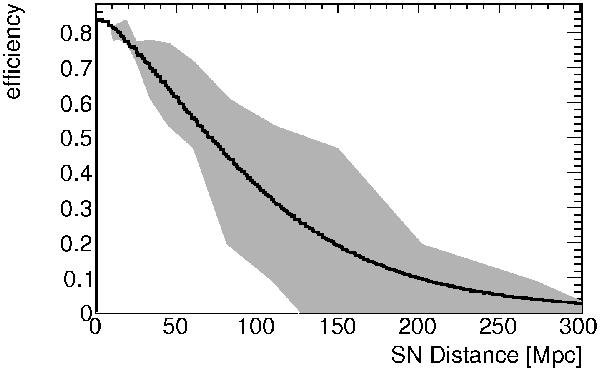
Black curve: efficiency to detect core-collapse SN as a function of the distance to the SN assuming an absolute R-band magnitude of − 18 ± 1. Shaded region: lower bound assuming an absolute magnitude of − 17, upper bound assuming − 19. The breaks in the shaded regions are connected to the binning in Fig. 9. The binning effect is washed out in the black curve due to the assumed uncertainty in the absolute magnitude distribution of ± 1.
Current usage metrics show cumulative count of Article Views (full-text article views including HTML views, PDF and ePub downloads, according to the available data) and Abstracts Views on Vision4Press platform.
Data correspond to usage on the plateform after 2015. The current usage metrics is available 48-96 hours after online publication and is updated daily on week days.
Initial download of the metrics may take a while.