Fig. 5
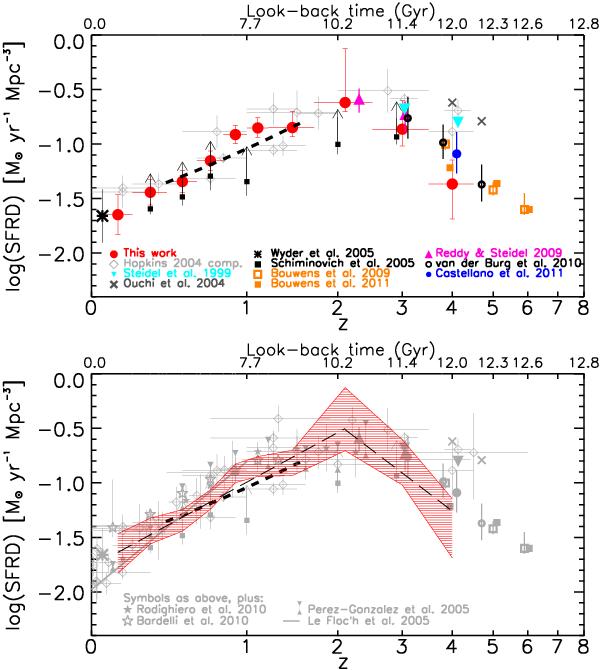
Top panel. Total dust-corrected UV-derived SFRDs as a function of redshift from the VVDS Deep+Ultra-Deep sample (red filled circles, see Table 1). Our uncertainties are explained in Sect. 3. The black dashed line is the SFRD(z) implied from the stellar mass density in Ilbert et al. (2010) (see text). We overplot other results from the literature, as detailed in the labels and at the end of the caption. Our SFRDs, as well as those from the literature, are derived using the FUV-band LDs converted into SFRD with the scaling relation from Madau et al. (1998). All data have been homogenised with the same IMF (Salpeter 1955). Bottom panel. Total dust-corrected UV-derived SFRDs as a function of redshift from the VVDS Deep+Ultra-Deep sample (red shaded area, corresponding to red circles and error bars in the top panel). The two long-dashed lines represent two fits to our SFRDs in the form ∝ (1 + z)β (see text for details). Gray points are from literature, derived from various SFR calibrators (UV, emission lines, IR, radio): they include the literature points as in the top panel, plus other works as in the labels. List of references, top panel. Compilation in Hopkins (2004) taking only the FUV and NUV determinations (grey open diamonds); Steidel et al. (1999) (LBG sample, cyan solid upside-down triangles); Ouchi et al. (2004) (SDF and SXDF LBGs sample, thick grey crosses); Wyder et al. (2005) (GALEX-2dFGRS, bold asterisk); Schiminovich et al. (2005) (GALEX-VVDS at z < 1.2 and HDF above, small solid squares with arrows); Bouwens et al. (2009) and Bouwens et al. (2011) (LBGs, orange open and filled squares, respectively); Reddy & Steidel (2009) (LBG, solid magenta triangles; van der Burg et al. (2010) (CFHTLS, black open circles); Castellano et al. (2012) (LBG, blue open circles). List of references, bottom panel. All the points in the top panel, plus: grey thin diamonds comes from the entire compilation reported in Hopkins (2004); Pérez-González et al. (2005) (12 μm, upside-down and normal solid triangles are the lower and upper limits; Rodighiero et al. (2010) (LIR Spitzer VVDS-SWIRE and GOODS, solid stars); Bardelli et al. (2010) (radio VLA-zCOSMOS, open stars); Le Floc’h et al. (2005) (24 μm Spitzer CDFS, solid line; from their Fig. 14).
Current usage metrics show cumulative count of Article Views (full-text article views including HTML views, PDF and ePub downloads, according to the available data) and Abstracts Views on Vision4Press platform.
Data correspond to usage on the plateform after 2015. The current usage metrics is available 48-96 hours after online publication and is updated daily on week days.
Initial download of the metrics may take a while.