Fig. 4
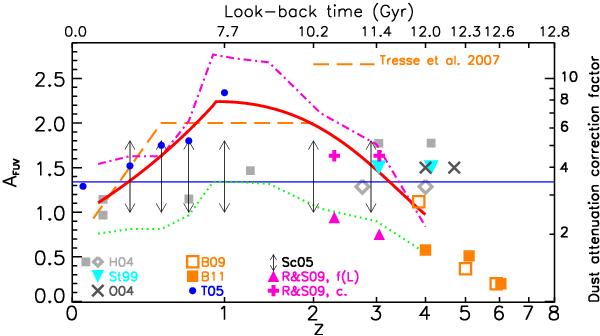
Dust attenuation AFUV in magnitudes as a function of redshift. The thick solid red curve represent the fit (see text for details) of the average dust attenuation, as a function of redshift, determined in this work, using the Calzetti’s law. The AFUV values derived from this fit in each redshift bin are listed in Table 1. The magenta dot-dashed curve is the average AFUV determined in this work using the recipe in Meurer et al. (1999), based on the β slope. The green dotted curve is the same as the dot-dashed one, but here we use the recipe in Cortese et al. (2006), calibrated with normal star forming galaxies. The thin blue horizontal solid line is a constant AFUV computed with the Calzetti’s law using one single typical value of E(B − V) (=0.13). The right y-axis shows the multiplicative factor to be applied to the observed luminosities, i.e., 100.4AFUV. All the other symbols represent dust attenuations found in literature, as indicated in the labels: orange dashed line from Tresse et al. (2007) (obtained comparing not-corrected SFRDs with dust-corrected SFRDs from other works, see text for details); gray open diamonds and filled squares from the compilation in Hopkins (2004, H04) (only FUV and NUV determinations, diamonds and squares for a correction independent from or dependent on SFR, respectively); cyan filled upside-down triangles from Steidel et al. (1999, St99); thick gray crosses from Ouchi et al. (2004, O04); orange open and filled squares from Bouwens et al. (2009, B09) and Bouwens et al. (2011, B11) respectively (slightly shifted in redshift for clarity); blue filled circles from Takeuchi et al. (2005, T05), based on the 02h field GALEX-VVDS LFs (Arnouts et al. 2005) and the CDFS field Spitzer 15-μm LFs (Le Floc’h et al. 2005) at 0.2 < z < 1; arrows from Schiminovich et al. (2005, Sc05), also based on GALEX-VVDS survey; filled magenta triangles and magenta crosses from Reddy & Steidel (2009, R&S09) (triangles and crosses for a dust attenuation dependent on or independent from FUV luminosity, respectively).
Current usage metrics show cumulative count of Article Views (full-text article views including HTML views, PDF and ePub downloads, according to the available data) and Abstracts Views on Vision4Press platform.
Data correspond to usage on the plateform after 2015. The current usage metrics is available 48-96 hours after online publication and is updated daily on week days.
Initial download of the metrics may take a while.