Fig. B.3
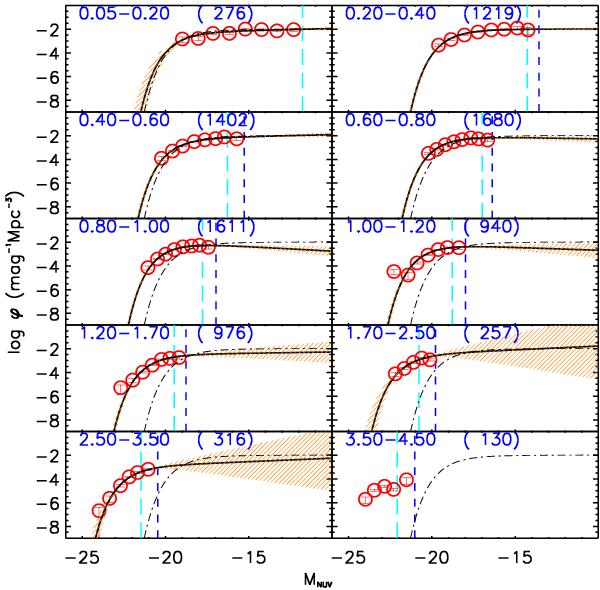
Rest-frame NUV-band LFs from z = 0.05 to z = 4.5 of the VVDS Deep+Ultra-Deep sample, in 10 redshift bins as indicated in each panel. Red circles represent the 1 / Vmax data points up to the LF bias limit and the corresponding number of galaxies are given in parenthesis. The vertical cyan long-dashed and blue short-dashed lines correspond to the LF bias limits for the Deep and Ultra-Deep surveys, respectively. The black solid curve and the associated shaded area is the STY LF estimate assuming free Schechter parameters and its associated error. The dot-dashed curve is the same in each panel, and it corresponds to the solid curve in the 0.2 < z < 0.4 redshift bin, as reference. All Schechter parameters are given in Table B.1. For the NUV-band, we were not interested in fixing either M∗ nor α. We note that in the last redshift bin the STY fit is unconstrained, so there is no solid curve overplotted.
Current usage metrics show cumulative count of Article Views (full-text article views including HTML views, PDF and ePub downloads, according to the available data) and Abstracts Views on Vision4Press platform.
Data correspond to usage on the plateform after 2015. The current usage metrics is available 48-96 hours after online publication and is updated daily on week days.
Initial download of the metrics may take a while.