Fig. 1
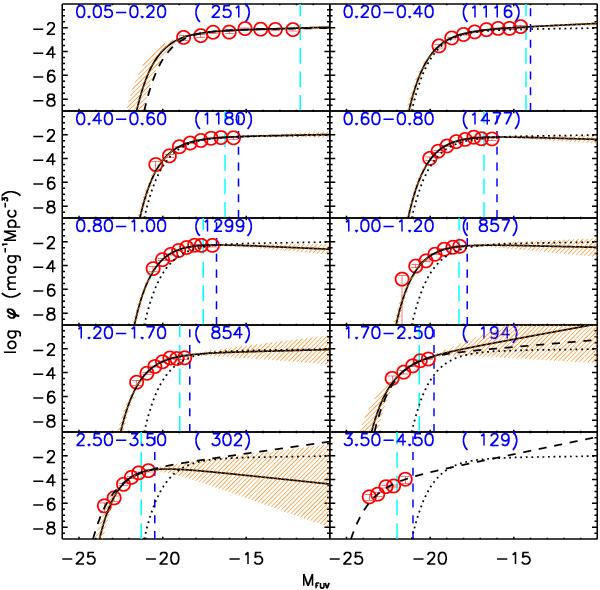
Rest-frame FUV-band luminosity functions in ten redshift bins from z = 0.05 to z = 4.50 of the merged Deep+Ultra-Deep VVDS sample. Redshift ranges are indicated in each panel. Red circles represent the 1 / Vmax data points with Poisson error bars, and the number of galaxies is given in parenthesis. 1 / Vmax points are plotted up to the LF bias limit (see Sect. 3.1) of the merged sample, represented with a vertical blue short-dashed line. This line corresponds also to the LF bias limit of the Ultra-Deep sample. The vertical cyan long-dashed line corresponds to the LF bias limit of the Deep survey. There is no Ultra-Deep data at 0.05 < z ≤ 0.2, so the only bias limit is the one of the Deep sample. The black solid curve and its associated orange shaded area is the STY LF estimate assuming free Schechter parameters and its associated error. At 3.5 < z ≤ 4.5, the STY LF fit does not converge using all free parameters. In the first redshift bin, the dashed curve is the STY LF estimate when setting  (see text), and for reference it is reported as a dotted curve in the other panels. In the 1.7 < z ≤ 2.5, 2.5 < z ≤ 3.5, 3.5 < z ≤ 4.5 panels, the dashed curve is the STY LF estimate when setting a faint-end slope that evolves with increasing redshift (i.e., α = −1.3, −1.5, −1.73, respectively). The Schechter parameters of all the curves shown in this plot are listed in Table B.1, while Table 1 summarises those that we retained for our study.
Current usage metrics show cumulative count of Article Views (full-text article views including HTML views, PDF and ePub downloads, according to the available data) and Abstracts Views on Vision4Press platform.
Data correspond to usage on the plateform after 2015. The current usage metrics is available 48-96 hours after online publication and is updated daily on week days.
Initial download of the metrics may take a while.