| Issue |
A&A
Volume 539, March 2012
|
|
|---|---|---|
| Article Number | A17 | |
| Number of page(s) | 16 | |
| Section | Interstellar and circumstellar matter | |
| DOI | https://doi.org/10.1051/0004-6361/201117714 | |
| Published online | 20 February 2012 | |
An icy Kuiper belt around the young solar-type star HD 181327
1
UJF-Grenoble 1 / CNRS-INSU, Institut de Planétologie et d’Astrophysique de
Grenoble (IPAG) UMR 5274, 38041
Grenoble, France
e-mail: This email address is being protected from spambots. You need JavaScript enabled to view it.
2
Exoplanets and Stellar Astrophysics Lab, NASA Goddard Space Flight
Center, Code 667, Greenbelt, MD,
20771,
USA
3
Department of Astronomy, University of Maryland,
College Park, MD
20742,
USA
4
Steward Observatory, The University of Arizona,
933 North Cherry Avenue,
Tucson, AZ
85721,
USA
5
Centre for Astrophysics & Supercomputing, Swinburne
University, PO, Box
218, Hawthorn,
VIC
3122,
Australia
6
LAEX, Depto. Astrofísica, Centro de Astrobiología
(INTA-CSIC), PO Box
78, 28691
Villanueva de la Cañada,
Spain
7
Institute for Astronomy, University of Hawaii at
Manoa, Honolulu,
HI
96822,
USA
8
Kapteyn Astronomical Institute, PO Box 800, 9700 AV
Groningen, The
Netherlands
9
ESO-ALMA, Avda Apoquindo 3846, Piso 19, Edificio Alsacia, Las Condes,
Santiago,
Chile
10
Calar Alto Observatory, Centro Astronómico
Hispano-Alemán, C/Jesús Durbán
Remón, 2-2, 04004
Almería,
Spain
11
Astronomy Department, University of California,
Berkeley
CA
94720-3411,
USA
12
Université de Lyon, 69003 Lyon; Université Lyon 1, Observatoire de
Lyon, 9 avenue Charles
André, 69230
Saint-Genis Laval ; CNRS,
UMR
5574, Centre de
Recherche Astrophysique de Lyon; École Normale Supérieure de Lyon,
69007
Lyon,
France
13
Eureka Scientific and Exoplanets and Stellar Astrophysics Lab,
NASA Goddard Space Flight Center, Code 667, Greenbelt, MD, 20771,
USA
14
Dep. de Física Teórica, Fac. de Ciencias, UAM Campus Cantoblanco,
28049
Madrid,
Spain
15
CEA/IRFU/SAp, AIM UMR 7158, 91191
Gif-sur-Yvette,
France
16
SUPA, Institute for Astronomy, University of Edinburgh, Royal Observatory
Edinburgh, UK
17
School of Physics & Astronomy, University of St. Andrews,
North Haugh,
St. Andrews
KY16 9SS,
UK
18
UK Astronomy Technology Centre, Royal Observatory, Edinburgh, Blackford
Hill, Edinburgh
EH9 3HJ,
UK
Received: 15 July 2011
Accepted: 6 December 2011
Abstract
Context. HD 181327 is a young main sequence F5/F6 V star belonging to the β Pictoris moving group (age ~12 Myr). It harbors an optically thin belt of circumstellar material at radius ~90 AU, presumed to result from collisions in a population of unseen planetesimals.
Aims. We aim to study the dust properties in the belt in details, and to constrain the gas-to-dust ratio.
Methods. We obtained far-infrared photometric observations of HD 181327 with the PACS instrument onboard the Herschel Space Observatory⋆, complemented by new 3.2 mm observations carried with the ATCA⋆⋆ array. The geometry of the belt is constrained with newly reduced HST/NICMOS scattered light images that allow the degeneracy between the disk geometry and the dust properties to be broken. We then use the radiative transfer code GRaTeR to compute a large grid of models, and we identify the grain models that best reproduce the spectral energy distribution (SED) through a Bayesian analysis. We attempt to detect the oxygen and ionized carbon fine-structure lines with Herschel/PACS spectroscopy, providing observables to our photochemical code ProDiMo.
Results. The HST observations confirm that the dust is confined in a narrow belt. The continuum is detected with Herschel/PACS completing nicely the SED in the far-infrared. The disk is marginally resolved with both PACS and ATCA. A medium integration of the gas spectral lines only provides upper limits on the [OI] and [CII] line fluxes. We show that the HD 181327 dust disk consists of micron-sized grains of porous amorphous silicates and carbonaceous material surrounded by an important layer of ice, for a total dust mass of ~0.05 M⊕ (in grains up to 1 mm). We discuss evidences that the grains consists of fluffy aggregates. The upper limits on the gas atomic lines do not provide unambiguous constraints: only if the PAH abundance is high, the gas mass must be lower than ~17 M⊕.
Conclusions. Despite the weak constraints on the gas disk, the age of HD 181327 and the properties of the dust disk suggest that it has passed the stage of gaseous planets formation. The dust reveals a population of icy planetesimals, similar to the primitive Edgeworth-Kuiper belt, that may be a source for the future delivery of water and volatiles onto forming terrestrial planets.
Key words: stars: individual:HD 181327 / circumstellar matter / infrared: planetary systems / radiative transfer
Herschel is an ESA space observatory with science instruments provided by European-led Principal Investigator consortia and with important participation from NASA.
The Australian Telescope Compact Array is operated by the Australian Telescope National Facility (ATNF) managed by CSIRO.
© ESO, 2012
1. Introduction
The evolution of planets in the solar system is intimately connected to the existence of a reservoir of planetesimals in its outer regions. The depletion of the Kuiper belt and the main asteroid belt that occurred during the late heavy bombardment not only delivered large amounts of water, volatiles and carbonaceous material onto the inner planets, but it also reduced the later rate of catastrophic impacts onto the Earth, opening the path to the emergence of life (Morbidelli et al. 2000; Greaves & Wyatt 2010; Hartogh et al. 2011). Although detecting Kuiper belt-like objects around nearby planetary systems will remain an unachievable goal for the foreseeable future, their collisional erosion produces circumstellar disks of dust responsible for a characteristic excess emission detectable at infrared and sub-millimeter wavelengths. Recent studies using the Herschel Space Observatory reveal that as much as ~30% of nearby Main-Sequence F, G, K stars are surrounded by cold debris rings analogous to the Kuiper belt (latest Herschel/DUNES open time key program results, Eiroa et al., in prep.). However, the cold temperature and the large grain sizes make it impossible to detect solid-state features in their spectrum, thus preventing unambiguous identification of the dust composition. We are thus left with model-dependent methods to constrain the dust composition from color and polarimetric measurements, and from the spectral energy distribution (hereafter SED).
Another uncertainty in planet formation theories lies in the lack of detailed observational constraints for the mutual dust and gas dissipation timescales in circumstellar disks, or more precisely, on how the gas-to-dust mass ratio evolves with time and location in disks at the very early stages of planet formation. The study of stellar clusters of different ages shows that, statistically, a population of young stars loses its massive dust disks in only a few million years on route to the main sequence (Carpenter et al. 2005), although, for individual objects, the transition from an optically thick to an optically thin disk is expected to occur more quickly (a million years or less, Cieza et al. 2007; Currie & Sicilia-Aguilar 2011). However not much is known about the characteristic evolutionary timescales for the gas in these disks. Observing young stars at different evolutionary stages can help elucidate the extent to which gas and dust simultaneously dissipate in disks. This requires observations of both the dust and gas components and, at the same time, modeling of the continuum and line emission.
As part of the GASPS (Gas in Protoplanetary Systems) Herschel Open Time Key Programme, we observed HD 181327, a young (~12 Myr) F5.5V star located at 51.8 pc (Holmberg et al. 2009, Table 1) belonging to the β Pictoris moving group (Zuckerman & Song 2004; Mamajek et al. 2004). HD 181327 was identified as a debris disk hosting main sequence star through its SED with a fractional infrared luminosity LIR/L⋆ = 0.2% (Mannings & Barlow 1998). Schneider et al. (2006), from NICMOS coronagraphic observations in scattered light, discovered a ring-like disk of circumstellar dust located at radius ~89 AU from its star. The ring is inclined by 31.7 ± 1.6° from face-on and shows an apparent brightness assymetry with respect to the minor axis that is well explained by a strong directionally preferential scattering. No photocenter nor pericenter offset is seen in the ring relative to the position of the central star and the disk appears axisymmetric. Recent reprocessing of these data (Schneider et al., in prep.) confirms the annulus shape of the disk, and suggests a narrow radial distribution of the dust in the system (FWHM = 24.5 AU). A low surface brightness diffuse halo is seen in the NICMOS image and in complementary HST/ACS images at a distance of ~4′′ ≤ r ≤ 9′′ from the central star, which may correspond to a population of very weakly bound grains originating in the main ring. Mid-infrared images at 18.3 μm by Chen et al. (2008) suggest azimuthal asymmetries in the density profile of the ring with respect to the apparent minor axis. These 18.3 μm observations also show that little to no emission (≲ 15%) comes from inside the ring resolved in scattered light. Therefore, the density profile of the HD 181327 dust disk should be well constrained by the scattered light and thermal emission images, allowing a detailed study of the dust properties. Interestingly, from IRS and MIPS-SED data, Chen et al. (2008) also inferred the presence of crystalline ice in the debris disk.
In this paper we perform SED and line fitting of new Herschel/PACS observations of HD 181327 (presented in Sect. 2), supplemented by data from the literature. We also present new ATCA imaging of the disk (Sect. 2). In Sect. 3, we derive surface density profiles from the newly reduced HST/NICMOS data, which well constrain the ring geometry. We describe our dust model and present the results of the SED fitting in Sects. 3 and 4. We assess the gas content in this young debris disk in Sect. 5. Finally we discuss the results in Sects. 6–8 and present our conclusions in Sect. 9.
Star and disk properties.
2. Observations and data reduction
2.1. Herschel/PACS continuum
We obtained new far-IR photometry and spectroscopy of HD 181327 using the PACS instrument onboard the Herschel Space Observatory (Pilbratt et al. 2010; Poglitsch et al. 2010). The observations were carried out in two modes: 1) 159 s of point-source chop-nod mode imaging at 70 and 160 μm (obsid: 1342183658) and 2) two 276 s scan map imaging observations at 100 and 160 μm (obsids: 1342209057-8). The scan maps were executed with the medium scan speed (20″/s), at scan angles of 70° and 110°. The two cross scan maps at different scan angles were combined to increase the signal-to-noise by cutting down on streaking in the image background along the scan direction.
We reduced the photometry with the Herschel Interactive Processing Environment (HIPE, Ott 2010) version 4.2. The uncertainties in the absolute flux calibration for this version are 10% at 70 and 100 μm and 20% at 160 μm (see the PACS Scan Map Astronomical Observation Templates release note1). For the 70′′ and 160 μm chop-node images, we performed aperture photometry using apertures of 7″ and 11″, respectively. For the 100 and 160 μm scan map observations, we used apertures of radii 12″ and 24″, respectively. An annulus for sky background estimation was placed from 10″−20″ beyond the aperture in each case, and an aperture correction was applied to the measured fluxes. Both estimations at 160 μm are fully compatible within the error bars; the 160 μm scan-map flux is used in the rest of the study. Since the source is marginally resolved at 70 and 100 μm (see Sect. 2.1), we calculated our own aperture corrections following the procedure described in Poglitsch et al. (2010). The photometry results are presented in Table 2.
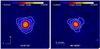 |
Fig. 1 PACS 70 μm imaging of (left) HD 181327 and (right) a PSF reference star, HD 148387. Both images were acquired in chop-nod mode. The field of view of each image is 25″ × 25″. Brightness contours at 5, 10, 25, 50 and 75 times the background noise in the HD 181327 image are overlaid on both images. |
HD 181327 is more extended than the Herschel point-spread function (PSF) in both the 70 μm and 100 μm images. The 70 μm image of HD 181327 appears in Fig. 1, along with the 70 μm image of a PSF reference star (HD 148387) observed using the same chop-nod mode. The upper panel of Fig. 2 shows the azimuthally-averaged radial brightness profiles for HD 181327 and HD 148387. In the case of the 100 μm scan map observation of HD 181327, we used a different PSF reference observation, i.e. a scan map of α Boo. The 100 μm α Boo radial profile appears in Fig. 2, bottom panel. At both wavelengths, the azimuthally averaged radial profile of HD 181327 is clearly extended beyond that of the PSF reference. The FWHM of the HD 181327 70 μm profile is  , compared to a FWHM of
  for HD 148387. At 100 μm, the FWHM for HD 181327 is
  , compared to
  for α Boo.
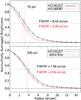 |
Fig. 2 Radial profiles of HD 181327 at 70 μm (top), compared to HD 148387 as a PSF reference, and at 100 μm (bottom), compared to α Boo as a PSF reference. Both plots show the azimuthally averaged, normalized radial brightness profile vs. radius from the star. Each error bar is the standard deviation of the brightness values at that radius. The FWHM values for the profiles are given on the plot. |
2.2. ATCA 3.2 mm observations
The Australia Telescope Compact Array (ATCA) was used to observe HD 181327 at 3.2 mm in May and September 2010. The observations were carried out in continuum double sideband mode, with 2046 × 1 MHz channels per sideband with an effective total bandwidth of just over 2 GHz. The ATCA has five antenna with 3-mm receivers, and our observations were carried out with the compact H75 array configuration with baselines of 31–98 m. The quasars PKS 1815-553 and PKS 1253-055 were used for the gain and bandpass calibrations respectively, and Uranus was used for the absolute flux calibration. The ATCA calibration uncertainty is estimated to be about 20% in the 3-mm band.
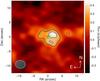 |
Fig. 3 ATCA 93.969 GHz (3.192 mm) map of HD 181327 with contours at −2 (dashed red line), 2 and 3σ (solid blue lines), where σ is the image rms given by 1.1 × 10⁻⁴ Jy/beam. The dashed blue area represents the beam. The Gaussian fit is overplot with contours at 2 and 3σ (solid green lines). The red and green crosses denote respectively the star position and the Gaussian fit center. |
The data were calibrated and reduced with the MIRIAD package (Sault et al. 1995). The frequency pair for the observations were centered at 93 and 95 GHz, and during the reduction process the data was averaged over 64 channels to improve the signal-to-noise, shifting the frequency pairs to 92.968 and 94.969 GHz. The final CLEANed map combined the two sidebands, resulting in an image at 93.969 GHz (3192.5 μm) presented in Fig. 3. Our total on-source integration time was 770 minutes. We determined an integrated flux of 7.2 × 10⁻⁴ Jy, with an rms of σ = 1.1 × 10⁻⁴ Jy/beam. Including the 20% calibration uncertainty, this yields an uncertainty of 2.5 × 10⁻⁴ Jy. The disk is marginally resolved. Assuming a Gaussian profile, we find a PA of ~102°, consistent with that seen on the NICMOS image (107 ± 2°, Table 1), and along which the FWHM is ~7.8″ (beam: 3.5″ × 2.8″, PA = 85.4°). The center of the Gaussian fit is also shifted by 0.6′′ toward the West with respect to the star position2. Structures consistent with a belt at ~100 AU are detected along the semi-minor axis with a peak flux of 4.01 × 10⁻⁴ Jy/beam on the NW side. We note a possible brightness asymmetry with respect to the SE side.
2.3. Herschel/PACS spectroscopy
We obtained far-infrared spectroscopy using the PACS integral field unit which provides a 5 × 5 array of  spaxels. The data were taken in chop-nod mode using the line scan and range scan modes. The spectra cover eight small wavelength ranges (~1.8 μm wide) targeting particular emission lines, including [O i] at 63 μm and [CII] at 158 μm. The spectral resolution of the data varies between R ≈ 1100 and 3400. Additional details on the observations appear in Mathews et al. (2010).
The data were calibrated with the Herschel Interactive Processing Environment (HIPE) version 4.2. The wavelength-dependent flux and aperture corrections provided by the PACS development team were applied, giving an uncertainty in the absolute flux calibration of 30% (see the PACS Spectroscopy Performance and Calibration Document2). Significant emission was detected only in the central spaxel. No emission lines are seen, only continuum flux. The central spaxel spectrum centered on the [O i] 63 μm line appears in Fig. 4.
The continua were binned at half the instrumental FWHM and fitted with 1st degree polynomials, using the fluxes and errors produced by our HIPE reduction script. The HIPE uncertainties appeared to be slightly too small, however. New flux random errors were calculated from the rms of the data minus the continuum fits, over wavelength ranges spanning 6 to 14 times the instrumental FWHM, centered on the expected line rest wavelengths. The continuum fluxes at the rest wavelengths of the expected emission lines appear in Table 3. To determine the upper limit on the integrated line flux (Fint) for each available emission line, we integrated the data over a small wavelength range, either ±1 or ±1.5 resolution elements, centered on the rest wavelength of the expected emission line. The flux errors were propagated to determine the 1σ upper limit on each integrated line flux. The 3σ integrated line flux upper limits appear in Table 3 as well.
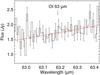 |
Fig. 4 PACS spectrum of HD181327, centered on the wavelength of the [O i] 63 μm emission line. The linear fit to the continuum flux is overplotted with the red line. The [O i] 63 μm emission line was not detected. |
3. Model setup
The dust and gas models developed in Sects. 4 and 5 rely on some assumptions on the spatial distribution of the dust and the gas, as well as on the dust properties. These are detailed below in Sects. 3.1 and 3.4. Additional data collected from the literature and stellar properties are summarized in Sect. 3.2.
3.1. New surface density profile for the HD 181327 ring
Our spatially resolved imaging constrains the location of the dust. We advantageously impose this constraint in order to examine the dust properties in details and to get an upper limit on the gas mass from the Herschel non-detections of gaseous emission lines. The disk around HD 181327 was spatially resolved in scattered light with HST/NICMOS 1.1 μm imaging by Schneider et al. (2006), which alleviates many uncertainties on the disk structure. The NICMOS images revealed a ring-like disk with a peak density position r0 = 1.71′′ (~88.6 AU, according to the new distance to the star, 51.8 pc, by Holmberg et al. 2009), with an azimuthally medianed photometric FWHM of ~0.538′′ (~28 AU).
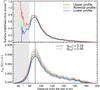 |
Fig. 5 New HST/NICMOS 1.1 μm surface brightness profiles (top, nominal and ±1σ profiles), and surface density profiles resulting from direct inversion of the brightness profiles (bottom), assuming two possible values for the asymmetry parameter. The color-coding is the same for both panels. The striped areas identify regions dominated by PSF-substraction residuals where the density has been extrapolated. |
Recently, Schneider et al. (in prep.) improved the data reduction of the original HST/NICMOS observations of HD 181327 thanks to PSF subtraction template images better matched to the stellar PSF structure in the HD 181327 images. This results in an overall improvement of the signal-to-noise, especially inside the ring, and leads to a slight sharpening of the belt. The new profiles, displayed in the top panel of Fig. 5, show a peak at a distance of 88.6 AU and a surface brightness fainter by ~21% (0.76 mJy arcsec-2 at the peak position) compared to the original Schneider et al. (2006) study.
We derive the surface density profile Σ(r) by inverting the new scattered light surface brightness profile. We employ the methodology described in Augereau & Beust (2006), assuming a disk inclination of i = 31.7° from face-on. The inversion procedure yields the product σscaΣ(r), where σsca is the mean scattering cross section of the grains at 1.1 μm. This is equivalent to the product of the vertical optical depth τ⊥(r), multiplied by the mean albedo ω at that wavelength (σscaΣ(r) = ωτ⊥(r), see Eqs. (2), (3) in Schneider et al. 2006). The inversion solution depends on both the anisotropic scattering phase function, and on the disk vertical profile. Nevertheless, Schneider et al. (2006) showed that the density profile is largely independent of the shape for the vertical dust distribution in the range of acceptable vertical scale heights H0. We here assume a Gaussian vertical profile with a scale height H0 = 6 AU at the observed peak radius of the ring r0 = 88.6 AU (H0/r0 ~ 0.068, consistent with the theoretical lower limit of 0.04 from Thébault 2009). The observed phase function of the disk at 1.1 μm is well-represented by a Henyey-Greenstein scattering phase function with asymmetry parameter |gHG| = 0.30 ± 0.03. This value was discussed by Chen et al. (2008) in light of asymmetries identified in T-ReCS thermal emission images in the Qa-band. Chen et al. (2008) suggest that the asymmetries may have led to an overestimate of |gHG|, which may be as small as 0.16 ± 0.04. We thus perform the inversion for both |gHG| = 0.16 and |gHG| = 0.30.
The results are displayed in the bottom panel of Fig. 5, where we also show the impact of the surface brightness uncertainties on the inferred surface density profile. We find an actual surface density peak at 89.5 AU from the star. A higher |gHG| leads to a globally higher surface density profile. The surface brightness measured interior to ~1.5′′ (~78 AU) is not reliable because of PSF subtraction residuals. We fit the profiles from 79 to 83 AU obtained for both |gHG| values by a very steep power-law function of the form ~r+10±1. We extrapolate this profile interior to 78 AU as shown in Fig. 5 (striped area). This extrapolation is supported by the mid-IR results of Chen et al. (2008), who show that the inner part of the disk is largely cleared toward the center, containing little to no dust.
Outside of the belt peak position, the improved data reduction results in a profile that falls off as ~r−4.7±0.3 from ~92 to 162 AU, a steeper fall-off than the Schneider et al. (2006) original profiles (~r-3). The dust is thus more tightly confined to the parent-belt than previously estimated, and the profile is also steeper than theoretical expectations. The exact value of the outer slope can only slightly impact the modelling results, as most of the emission arises from the inner part of the belt where the temperature is larger, except possibly for the longer-wavelengths.
Eventually, the differences between the several radial profiles in Fig. 5 essentially translate into a scaling factor that impacts the total disk mass estimate. We estimate that the uncertainty on the asymmetry parameter adds an additional ~4% to the uncertainty on our final mass values. The density profile obtained for |gHG| = 0.30 is used in the rest of this study. We stress that, in order to focus on the other disk properties, we make the assumption that this profile is valid for any dust grain constrained by the SED, i.e. for grain sizes ranging from the micron to the millimetre scale. This assumption assumes no radial segregation in dust sizes and it remains reasonable as long as the flux at any wavelength arises predominantly from regions close to the density peak position (see Sect. 6.1).
3.2. Spectral energy distribution
The Herschel and ATCA data presented in this paper are complemented by IR and sub-mm data collected from the literature. These are listed in Table 4. The shortest wavelength flux we use is the 12 μm IRAS photometry for which the emission shows no excess from the stellar photosphere level. This observation is documented in Schneider et al. (2006) together with IR-excess from the IRAS Faint Source Catalogue and obtained with the Spitzer/MIPS instrument. These are complemented by ground-based mid-IR measurements performed with the T-ReCS imager on Gemini-S by Chen et al. (2008), and 13 points extracted from the 5–35 μm Spitzer/IRS spectrum that we reduced using the c2d Legacy team pipeline (Lahuis et al. 2006).
Additional MIPS observations were obtained in SED-mode by Chen et al. (2006) between 54.5 and 95.5 μm, well-constraining the shape of the disk SED around its maximum emission wavelength. Far-IR excess was reported by Moór et al. (2006) using the ISO database. The shape of the SED in the far-IR domain (100–200 μm) is well constrained by our new Herschel measurements.
Because the uncertainties on the dust optical constants at millimetre wavelengths are high, we chose not to use the ATCA flux to constrain the dust model (see Sect. 6.1 for a discussion on the compatibility of the model to these observations). Therefore, the sub-mm regime is only represented by a measurement with the LABOCA bolometer array at the 12-m telescope APEX (Nilsson et al. 2009, λ ~ 870 μm), which thus represents a key piece of information. These archival data, together with our new observations, constitute the 49 measurements that are displayed in Fig. 6.
3.3. Star properties and dik geometry
We derive excesses from a comparison of the SED with a synthetic stellar spectrum extracted from the “NextGen” model atmosphere grid (Hauschildt et al. 1999) and scaled to match the visible magnitude V = 7.0 mag (Bessell 2000), assuming log (g) = 4.5, Teff = 6600 K, which leads to a stellar luminosity of 3.33 L⊙ and a mass of 1.36 M⊙. This stellar model shows good agreement with the Spitzer/IRS spectrum at wavelengths shorter than 10–15 μm, longward of which the excess starts dominating over the stellar photospheric emission. The star properties and disk geometry adopted in this study are summarized in Table 1.
3.4. Dust properties: size distribution and composition
Parameter space explored with Grater , corresponding to a total of about 1 150 000 models.
For both the dust and gas modeling, we make the assumption that the grain population has a single differential size distribution valid anywhere in the ring. This is a central hypothesis that necessarily limits the uniqueness of the solution. We discuss its impact in Sect. 6. The differential size distribution follows a classical power law dn(a) ∝ aκda, from a minimum size amin to a maximum size amax. The minimum grain size amin and the power law exponent κ are free parameters that are constrained by the SED fitting (Sect. 4). The maximum grain size amax is a fixed parameter, sufficiently large so that it does not affect the light emission properties at the wavelengths considered (we chose amax ~ 8 mm). For standard κ values (close to −3.5 or smaller), the mass of solid material in a debris disk can be “arbitrarily” large depending on the assumed higher cut-off value of the size distribution (that can extend up to planetesimal sizes). In this article, we define the dust mass Mdust as the total mass of material contained in grains smaller than 1 mm. This definition has been followed within the GASPS consortium because it allows direct comparison between different studies independently from the model assumptions.
We adopt a complex grain model that bears some similarities to those succesfully employed by several authors for fitting SEDs of young debris disks (Li & Greenberg 1998; Augereau et al. 1999; Li & Lunine 2003a,b), and for fitting scattered light disk colors (Köhler et al. 2008). We consider icy porous aggregates, with silicate cores and organic refractory mantles (or simplified versions of this model; see Sect. 4), to mimic fluffy particles made of essentially unalterred interstellar material (the so-called “cold-coagulation” dust model in Li & Lunine 2003a,b). Assuming cosmic abundances, the volume of the carbonaceous mantle VC is estimated to be ~2.12 times that of the silicate core VSi in the interstellar medium, a value similar to the one derived from the mass spectra of comet Halley in the solar system (VC/VSi ~ 2, Greenberg 1998).
To calculate the optical properties, we use a number of representative materials with well established optical indexes. These are either derived from laboratory measurements or from observational and analytical arguments. The materials are: (1) the astronomical silicates (astroSi) from Draine (2003), a theoretical material consisting of amorphous silicates polluted by carbonaceous materials and other metals (ρ = 3.5 g cm-3); (2) the ACAR sample of amorphous carbon from Zubko et al. (1996) as organic refractories (ρ = 1.95 g cm-3); (3) the H2O-dominated ice from Li & Greenberg (1998) (amorphous ice, ρ = 1.2 g cm-3); and (4) the crystalline water ice from Warren (1984) (ρ = 0.92 g cm-3).
The optical indexes of an aggregate are obtained using a standard effective medium theory (EMT), the Bruggeman mixing rule (Bohren & Huffman 1983), and following the methodology of Li & Greenberg (1998) and Augereau et al. (1999). The optical properties are computed with Mie theory valid for hard spheres. The EMT-Mie combination has been shown to be a good approximation for the absorption and scattering efficiencies, provided that grain shapes are close to ellipsoids such that the porosity can effectively be seen as the volume fraction of vacuum (Shen et al. 2009, and references therein). In fact, Shen et al. (2009) show that only the polarization and the phase functions are significantly sensitive to grain shapes. We define the composition of a grain through the volume fractions of its different components: 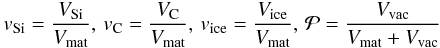 (1)where VSi, VC, Vice and Vvac are the total volume of astronomical silicates, carbonaceous material, ice and vacuum in the grain, respectively, and Vmat = VSi + VC + Vice is the total volume of solid material.
  denotes the porosity. Should one of the materials within the grains reach its sublimation temperature, it is replaced by vacuum and the optical properties are adjusted accordingly in the model. In most cases however, the disk is too cold for any material to sublimate. Figure 7 shows the mass opacity (absorption cross section per unit mass) calculated using Eq. (4) of Draine (2006) for several prototypical dust compositions, with the size distributions given in Table 6.
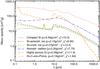 |
Fig. 7 Mass opacity of spherical grains computed with the Mie theory and Bruggeman mixing rule for several prototypical compositions detailed in Table 6 and their associated best-fit size distributions. |
4. Modeling the dust continuum emission
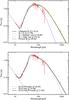 |
Fig. 8 Best fit models (Table 6) for several 1- or 2-material mixtures (top) and 3- to 4-material mixtures (bottom). Red crosses: photometric data (Fig. 6). Solid grey line: synthetic stellar spectrum. |
We use the Grater code (Augereau et al. 1999) to compute a grid of models with a goal of reproducing the HD 181327 spectral energy distribution. Grater is a SED, image and interferometric data fitter, specially designed to efficiently model optically thin disks with parametric grain size and radial distributions, or distributions from dynamical simulations. The code accounts for both the scattered light and continuum emission of dust grains in thermal equilibrium with a star.
In the present case, the spatial dust distribution is constrained by the resolved HST images (Sect. 3.1, Fig. 5). The surface density profile derived from inverting the observed surface brightness was imposed in the model. Our study of the disk continuum emission focuses on the properties of the dust particles, namely their size distribution and composition. To that end, we computed large grids of models reflecting various possible dust properties, starting from the simplest composition (astronomical silicates) and progressively increasing the model complexity until obtaining a good match to the SED. For each model, the dust mass Mdust and the quality of the fitting are obtained from linear least-square fit between the observed and the synthetic SEDs. The χ2 listed in this section are obtained using the 48 data points presented in Tables 2–4, and with the numbers of degrees of freedom listed in Table 6. We subsequently use a statistical (Bayesian) inference method to derive the probability distribution of each parameter (see Appendix A).
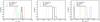 |
Fig. 9 Bayesian probabilities for the models in Table 6: minimum grain size, size distribution power law index, and total dust mass. |
In total we consider ~300 compositions, with 77 × 50 grain size distributions for each, leading to ~1 150 000 models. All the parameters of the grain models are summarized in Table 5.
4.1. First steps toward a complex dust model
We start by fitting the HD 181327 SED with a single- or two-material grain model, which show the need for a more complex dust model. We consider several mixtures of the materials presented in Sect. 3.4 to assess the broad properties of the grains. The model then includes 3 or 4 free parameters: (1) the minimum grain size amin; (2) the slope of the size distribution κ; (3) the total mass of the disk Mdust; and in the case of 2-component grains: (4) the volume fraction of either carbon (vC) or ice (vice), or the porosity (). The detailed results of the investigation are summarized in Table 6, the best-fitting SEDs are displayed in Fig. 8 (top panel) and probability curves are shown in Fig. 9.
4.1.1. Silicates or organic refractories?
The most basic grain model to consider is the case of compact spheres made of pure astronomical silicates (astroSi), a configuration that is often used by default in many modeling approaches. We let amin, κ and Mdust vary and we compute a grid of χ2 on which we apply a Bayesian analysis. We find that pure astronomical silicate grains would have amin = 0.99 ± 0.13 μm and κ = −3.43 ± 0.04, leading to a total dust mass Mdust = 0.35 ± 0.03 M⊕ for grains smaller than 1 mm (Table 6). These values are consistent with the ones typically found for debris disks, but they actually lead to very poor fits, as illustrated in Fig. 8 (top panel) where the model with the smallest χ2 ( ) is displayed. Although the model is in fairly good agreement with the data over the full spectral range and agrees well with the sub-mm measurement, it fails to reproduce the shape of the emission peak at ~50−100 μm and the mid-IR fluxes, shifting the dominant part of the disk to colder temperatures. It overestimates by 30–40% the excess at far-IR wavelengths (λ ~100−160 μm), in particular the Herschel/PACS measurements.
Best-fitting (Best, i.e. lowest  ) and most probable (Proba, i.e. highest probability) parameters assuming different grain compositions (see text for the definition of the parameters).
We take a further step and consider mixtures of amorphous silicates and carbonaceous materials. We ran a Bayesian analysis and find that the actual best composition corresponds to pure carbon. Qualitatively, the effect on the SED is not significant (see Fig. 8, top panel), even if it leads to a better minimum chi-square ( ). This model gets closer to the measured fluxes at the peak emission (λ ~ 50−100 μm), but does not provide an overall good fit. The addition of carbonaceous material slightly shifts the best fit parameters of the grain size distribution (Table 6), resulting in slightly larger amin values and slightly steeper size distributions
4.1.2. Icy grains?
Chen et al. (2008) suggested that HD 181327 may contain a significant fraction of water in the form of crystalline ice, producing a broad peak in the combined Spitzer/IRS (5–35 μm) and MIPS-SED (60–77 μm) spectrum. To assess the presence of water ice in the debris disk of HD 181327, we model the disk with grains made of a mixture of astronomical silicates and water ice, either in the form of amorphous ice or crystalline ice.
The results of the statistical analysis are documented in Table 6. The quality of the fit is only slightly improved compared to the pure silicate model: the best models have  for amorphous ice,
  for crystalline ice. In fact, the addition of water ice, crystalline or amorphous, does not modify the general shape of the synthetic SED (see Fig. 8, top panel). The smallest χ2 calculated with amorphous ice is slightly smaller than the one of crystalline ice, but in both cases the values are too high to accept these models.
4.1.3. Porous grains?
As a final step in our preliminary study of the dust composition, we consider a grid of models consisting of silicate grains with different porosities, from compact silicates to extremely fluffy silicate grains ( ). The marginal probability distribution for the porosity reveals a bimodal probability distribution: the most probable models are the ones with either no porosity (discussed in Sect. 4.1.1), or very high porosity (
 ). Both solutions are presented in Table 6. A visual inspection of Fig. 8 resolves the ambiguity. The compact grain model better reproduces the minimum and maximum wavelength ends of the SED, and in particular fits the sub-mm point, but it fails at reproducing the intermediate wavelength range around the emission peak. On the other hand, the highly porous grain model is orders of magnitude below the observed value at 870 μm, but it is within the error bars in the other regions of the SED, especially at Herschel wavelengths. In sum, none of these models lead to overall good fits to the whole SED.
4.2. Construction of an advanced grain model
From what precedes, we conclude that none of the 2-component mixtures considered are sufficient to provide a satisfactory fit to the SED. This is essentially a consequence of the disk surface density being known a priori in this model; it cannot be adjusted to compensate for the emission properties of the dust grains. We note, however, that the addition of one component to silicates, should it be carbonaceous material, amorphous ice, or porosity, provides some slight improvements. This suggests that their combined effect could produce a more realistic model.
We evaluate the improvement provided by a 3-component mixture on the fitting of the SED. We showed in Sect. 4.1.1 that it is not clear how to disentangle the respective contribution of silicates and organic materials by looking at the SED. Instead of including an additional free parameter, we consider grains (approximately) in fixed Si/C ratio described in Sect. 3.4 (vC/vSi = 2), and we restrict the discussion to the ice fraction and the porosity of the grains. We thus assume that grains are made of silicate and carbonaceous material, which are either icy (vice parameter) or porous ( parameter). The results are reported in Table 6. For porous ice-free grains, the best model is found for a porosity  % and leads to some improvement to the fit with
  . If we now consider only compact icy grains, we can achieve a very reasonable
  with comparison to previous models, assuming an amorphous ice fraction vice = 0.7. Overall, both the addition of either water ice or vacuum to silicate + carbonaceous grains do contribute to improving the fit to the SED of HD 181327. This can can be seen in Fig. 8 (bottom panel). Nevertheless, the fits are still unsatisfactory ( much larger than 1), and justify an even more advanced dust model.
We next consider a 4-component grain model inspired by the “cold coagulation dust model” by Li & Lunine (2003a,b), which has been successfully employed for modeling debris disks (Li & Greenberg 1998; Augereau et al. 1999; Li & Lunine 2003a,b; Köhler et al. 2008). We keep the Si/C volume ratio fixed (vSi:vC = 1:2) and let both the ice fraction and the porosity vary, in addition to the other usual free parameters in this study, namely the minimum grain size amin, the slope of the size distribution κ, and the total mass of the disk Mdust. This leads to a five-free-parameter disk model to fit the 48 data points in the SED. We compute three grids of models corresponding to the three surface density profiles shown in Fig. 5 for |gHG| = 0.30 (i.e. the nominal and ± 1σ profiles). The Bayesian analysis is then applied to the 3 grids separately and the probabilities for each point of the parameter space are calculated as the sum of the probabilities for the 3 profiles. The detailed results are documented in Table 6.
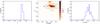 |
Fig. 10 Bayesian probabilities for the grain composition in the case of 4-material dust mixtures. |
Figure 10 presents the results of the Bayesian analysis on the composition of the dust grains, with a 2D-map showing the probability as a function of and vice for the grid models, after projection of the probabilities over the other parameters. It clearly illustrates the need for a composition within a limited range of possible values. In particular, the fraction of H2O-dominated ices is well defined: the probability peak is obtained for an ice fraction vice = 0.67 ± 0.07. The porosity is not so strongly constrained but we find a peak of probability for  . The best fit model in terms of χ2 is found for grains made of 23% carbonaceous materials, 12% silicates, 65% ice, and with a porosity
  . As can be seen in the bottom panel of Fig. 8, for such grains, the synthetic SED very reliably describes the observed SED from the mid-IR to the sub-mm, with
  , a value significantly better than those obtained for simpler grain models. The grain size distribution derived from the statistical analysis has amin = 0.81 ± 0.31 μm and κ = −3.41 ± 0.09, a power law index very consistent with that predicted for theoretical collisional cascades (κ = −3.5). The mass in grains smaller than 1 mm, Mdust = 0.051 ± 0.016 M⊕, may look surprisingly small at first glance compared to the other models, but it results from the significant fractions of ice and vacuum in the grains, implying larger mass opacities (Fig. 7). The temperature of the grains at the surface density peak position (89.5 AU) ranges from 86 K for the smallest grains to 40 K for ~8 mm-sized grains.
To summarize, our approach, based on a fixed surface density profile constrained by resolved imagery of the disk, clearly highlights the need to consider the presence of both ice and porosity to find an overall good fit to the SED. Icy grains are naturally expected at such a large distance from a solar-type star and the fluffiness of the grains is likely a by-product of their formation process. We applied a similar cold-coagulation dust model as Li & Lunine (2003a) did fitting the very young HD 141569A debris disk, except that we used no a priori assumption on the ice fraction, but with arguing the grain composition must reflect the primordial abundances of condensable elements, they chose vice ≈ 30% for cold regions and they find a best-fitting porosity  . Hence we propose a dust model that is especially ice-rich with a degree of porosity that is not unexpected. Further comparisons with the literature and implications on the nature of the dust are discussed in more details in Sect. 6.
5. Limits on the gas content
At 12 Myr-old, HD 181327 offers a chance to assess the amount of gas in a young debris disk, at a time when, according to planet formation theories, the accretion of gas by giant planets has already occurred while the formation of rocky planets might be ongoing.
We use the upper limits on the oxygen and ionized carbon fine-structure lines ([O I] at 63 and 145 μm, and [C II] at 158 μm, see Table 3) to constrain the amount of gas present in the disk. We solve the photochemistry and energy balance in the disk using the photochemical code ProDiMo3. The abundance of 71 species is computed in steady-state, under the influence of adsorption, desorption (thermal, photo and cosmic-ray induced), and molecular hydrogen formation on grain surfaces.
The gas density profile is supposed to match the one of the dust, as presented in Sect. 3.1. The total mass of solid (defined as the mass in grains from 0.81 μm to 8 mm) is constrained by the best dust model of Sect. 4.2 (Msolid = 4.9 × 10⁻⁷ M⊙ = 0.164 M⊕) and we let the total atomic+molecular gas mass Mgas vary from a gas-poor disk (Mgas/Msolid = 10-2) to a gas-rich disk (Mgas/Msolid = 103). The parameters of the model are summarized in Table 7. One of the main parameters controlling the gas energy balance is the amount of PAHs (fPAH), which remains unconstrained in the disk of HD 181327 because their abundance is too small to produce detectable PAH emission features in the IR. We adopted two “extreme” values for fPAH: a low PAH abundance (fPAH = 10-5) and a high PAH abundance (fPAH = 0.1)4.
The non-LTE line fluxes for the [O I] , [C II] , CO J = 3 → 2, and CO J = 2 → 1 transitions are given in Fig. 11 and Appendix B. Among all the lines, only the CO J = 3 → 2 and J = 2 → 1 line fluxes behave monotonically, increasing in flux with increasing disk mass. The reasons for the apparent erratic behaviour of the fine-structure lines come from the non-linear nature of several physico-chemical phenomena. For example, the [C II] flux depends on the abundance of C+ and on the excitation of the first energy level. The C+ abundance first increases with total gas mass until CO self-shielding against photodissociation is efficient enough such that a significant fraction of C+ is converted into neutral C and CO. The presence of CO also changes the heating and cooling balance, since the CO absorption of IR stellar photons becomes the main source of heating. The change from a disk with no CO self-shielding to a CO self-shielded disk manifests itself as a jump in CO fluxes between a disk with gas-to-solid ratio of 1 to a disk with gas-to-solid ratio of 10. The abundance of PAHs has a weak influence on the gas temperature because the small UV flux from a F5/F6 star without excess accretion luminosity cannot ionize PAHs. On the other extreme, when the gas mass is very small (at gas-to-solid mass ratio below 1), the PAH and molecular absorption heating are nonexistent. Photoelectric heating by large grains dominates and explains why the line fluxes are similar for the high and low PAH abundance models.
Line fluxes from models with fPAH = 10-5 are consistent with the PACS upper limits for all gas-to-solid mass ratios (upper part of Table B.1). Only in the case fPAH = 0.1, the disk gas mass is constrained by [OI] at 63 μm to be below ~17 M⊕ (Mgas/Msolid ≲ 102, lower part of Table B.1).
Eventually, even if the integration of the [O I] 63 and 145 μm, and [C II] lines we performed was not sufficient to derive strong constraints on the gas-to-solid mass ratio in the disk, the combination of the GRaTeR and ProDiMo codes proved efficient to make predictions on the fluxes in the CO J = 3 → 2 and J = 2 → 1 lines. These lines will be detectable for instance by ALMA, finally allowing to assess the gas content of the debris disk.
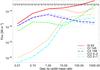 |
Fig. 11 Expected gas line fluxes as a function of gas-to-solid mass ratio for either a low-PAH abundance (thin lines) or a high-PAH abundance (thick lines). The horizontal lines denote the PACS 3σ upper-limits and do not include the 30% flux calibration uncertainty. The gas-to-solid mass ratios assume a solid mass of 0.164 M⊕. |
Setup of ProDiMo for the gas disk model.
6. Additional constraints on the disk
The surface density profile used in this study comes from a new reduction of the scattered light images of Schneider et al. (2006) obtained with HST/NICMOS (see Sect. 3.1). This ensures by definition that the shape of any synthetic scattered light surface brightness profile in this study perfectly agrees with the observed profile at 1.1 μm. However, the consistency is limited to the shape, and the agreement in terms of absolute flux is not guaranteed. This is because our fitting approach in Sect. 4 consists of adjusting the disk mass to get a best fit to the SED, which is equivalent to scaling up or down the surface density profile. A reason for adopting this strategy comes from the fact that the scattered light images do not directly provide the surface density Σ(r), but its product by the mean scattering cross section σsca at the observing wavelength (1.1 μm). The fitting process to the SED, on the other hand, yields an independent, absolute scaling of the surface density profile, thus allowing one to obtain an initial estimate of σsca. We find σsca = 3.7 μm2 in the NICMOS 1.1 μm band.
A second estimate of σsca is obtained by calculating the theoretical scattering cross section for compact spherical grains given the grain properties (composition, size distribution) that were inferred in Sect. 4: 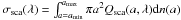 where Qsca is the scattering efficiency at wavelength λ and for a grain radius a. For the best model (in the Bayesian sense, Table 6) we find σsca = 16.8 μm2 at 1.1 μm, a factor of about 4.5 higher than the first estimate. This implies a peak flux density of 3.14 mJy arcsec-1 inconsistent with the 0.76 mJy arcsec-1 measured in the NICMOS profile. In other words, this means that our model predicts an albedo (ω = 59% at 1.1 μm) that is a factor of about 4.5 larger than the observed value. This suggests that smaller grains than those required to fit the SED dominate the scattering behavior of the disk. It is worth noting that such a conclusion is not specific to HD 181327, but is also observed in other debris disks. Recent examples include HD 207129 for which Krist et al. (2010) predict an albedo (based on dust properties also obtained from a fit to the SED) that is an order of magnitude larger than the value suggested by the scattered light image. A similar inconsistency is noticed for HD 92945 by Golimowski et al. (2011) who point out that different observing diagnostics suggest different minimum grain size.
It is important to keep in mind that although our model suggests the grains are very porous and hence likely to have an irregular, fractal structure, we used hard spheres (Mie theory) to calculate both the thermal emission and scattered light optical properties. Unlike the thermal behavior, light scattering will likely strongly depend on the exact shape of the dust aggregates, and on the size of their elemental constituents, two features that are not accounted for by the Mie theory (Voshchinnikov et al. 2007). Another piece of evidence that Mie theory might be a limiting factor for a self-consistent model of HD 181327 comes from the observed scattering asymmetry parameter gHG that is a measure of the direction of the light scattered by a particle. For our best model (Sect. 4.2) the Mie theory yields a mean scattering asymmetry parameter |gHG| = 0.95 at λ = 1.1 μm, much larger than the |gHG| = 0.30 measured on the NICMOS image. Only a population of much smaller particles could produce such a low scattering asymmetry parameter if we stick to the Mie formalism, as already noted by Schneider et al. (2006). An analogous problem arises from the modeling of the debris disk of HD 92945 (Golimowski et al. 2011). Our micron-sized grains are highly anisotropic, essentially due to their spherical shapes. Incorporating vacuum homogeneously inside the grains does not suffice to decrease |gHG| and a more accurate description of the shape of fluffy aggregates is eventually needed. In fact, the scattering efficiencies and asymmetry parameters of fluffy aggregates are known to be correctly described by an EMT-Mie model (porous spheres) only in the Rayleigh regime, i.e. when the size of the inclusion (vacuum here) is small compared to the wavelength (see e.g. Voshchinnikov et al. 2007). This is not the case for the relatively large grain sizes and porosity when the wavelength becomes small.
6.1. A narrower parent belt?
Unlike scattering, we expect the continuum thermal emission to be largely independent of the exact shape of the grains. Our best model of HD 181327’s disk produces a sub-mm flux of 39 mJy at 870 μm, consistent within 2σ with the LABOCA measurement (52 ± 6 mJy). The ATCA measurement at 3.2 mm was not model-fitted, because of large uncertainties on the optical constants at millimetre wavelengths. As a sanity check, we calculate the flux in the ATCA band using a power-law extrapolation of the SED. In the far-IR to mm regime, the model emission declines as λ−2.51 ± 0.165. This results in a flux equal to  mJy, which is within ~3 σ compatible with the measured flux of 0.72 ± 0.25 mJy. Thus, the model remains valid for the longest wavelength observations (coldest emitting particles), showing that the ring resolved in the near-IR with the HST is compatible with the spatial distribution of the largest grains, at least at first order.
A limit of our approach is the assumption that the grain size distribution is the same everywhere in the disk, while it is known that only the smallest grains can populate the outer disk due to radiation pressure. The maximum size and power law slope of the dust size distribution should vary with the distance from the star (e.g. Fig. 4 in Augereau et al. 2001), whereas the model keeps both large grains in the outer disk and a constant slope for the size distribution. Such a radial variation of the size distribution is suggested by a comparison of a synthetic image at 70 μm with the PACS 70 μm map (Sect. 2.1). The synthetic image appears broader than the observed one with a FWHM of 7.68″, versus 6.44″ for the PACS image. Our interpretation is that the PACS band reveals larger grains that experience less the force due to the radiation pressure and thus are more bound to the parent belt. Assuming all grains are equally distributed results in putting too many large grains in the outer disk: a more complex model should account for the true dynamics of the particles.
6.2. Emission from inside the belt?
The region of the disk interior to 75 AU cannot be reliably assessed from the NICMOS data because of the coronagraph and artefacts from the PSF-substraction interior to 1.5″ (78 AU). Therefore we cannot exclude the existence of an additional dust component interior to the main belt, that would be invisible in the surface density profile we use. If micron-sized grains populate the inner disk, they would radiate mainly in the mid-IR, which might affect the results of our study. From the Gemini/T-ReCS images of Chen et al. (2008), we estimate that less than ~15% of the light emitted by the disk at 18.3 μm originates from a region interior to 1″ (Fig. 2 in Chen et al. 2008).
We perform a simple test of the robustness of our results. Suppose that a belt of black body dust particles is orbiting the star at a distance r < 1″. We calculate a black body spectrum than peaks at 18.3 μm (T = 150 K) and we adjust it such that its maximum flux represents 15% of the 53 mJy attributed to the disk at that wavelength. Then we subtract the black body flux from the observed SED of Table 4 to simulate an observation of the system excluding the hypothetical inner component. We reproduce the approach of Sect. 4.2 with this new SED. Interestingly the results of the Bayesian analysis are not significantly impacted. To account for the deficit of flux at mid-IR wavelengths, only the minimum grain size needs to be slightly adjusted to eliminate the smallest grains: amin = 1.0 μm and κ = −3.43, while we have amin = 0.89 μm and κ = −3.42 for our best fit (Table 6). The composition remains unchanged for the best model ( ) and no change is induced that would improve the consistency of the model with the scattered light flux (Sect. 6). Consequently we cannot reject the possible existence of an inner component to the disk, but none of our conclusions would suffer from its existence.
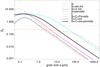 |
Fig. 12 βpr = |FP |/| FG| as a function of grain radius. The horizontal dashed line denotes the limit between bound (β < 1/2) and unbound (β > 1/2) grains. |
7. Grain dynamics and ice origin
7.1. Blowout size
Grains in the HD 181327 debris disk for which radiation pressure overcomes gravity are put on unbound orbits and eventually ejected from the system on a short time scale (see for instance Krivov 2010, and ref. therein). The balance between radiation pressure (FP) and stellar gravity (FG) forces is evaluated with the distance independent, but size-dependent, βpr factor, given by 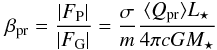 (2)where ⟨Qpr⟩ is the pressure efficiency averaged over the stellar spectrum, m the grain mass, σ the grain geometrical cross section, c the speed of light, G the gravitational constant, and L⋆ and M⋆ documented in Table 1. Assuming that the grains are spherical, Eq. (2) yields a critical size below which the grains originating from the parent belt are ejected from the system: ablow = a(βpr = 1/2) (assuming circular orbits for the parent bodies).
In Fig. 12, we represent the βpr ratios as a function of grain radius for different compositions. Our best 4-component grain model has a blowout size ablow = 4.83 μm, that is 5 times larger than the inferred minimum grain size in the system. Models implying no porosity nor carbon, on the other hand, have blowout sizes of the order of the inferred value of amin, more consistent with the theoretical argument that grains below the blowout size should be expelled from the system. The response of silicate grains to the stellar irradiation and gravity fields is only slightly affected by the presence of ice, leading to similar shape and moderated values for βpr(a). Organic refractory grains on the other hand are highly sensitive to the radiation pressure and they can reach high βpr values. Figure 12 shows that porosity has the effect of flattening the βpr(a) function, pushing the critical value βpr = 1/2 to larger grains. Hence the addition of porosity to a mixture of carbon and silicates produces a strong effect: βpr not only reaches a high value at its maximum due to carbon, but the βpr(a) function decreases slowly such that the critical value βpr = 1/2 is reached only for large grain sizes.
Decreasing the amount of carbon in the grains (it was imposed somehow arbitrarily, see Sect. 4.2) would mechanically decrease their blowout size. Pure silicate grains with the same porosity and ice content have ablow = 0.89 μm, but they do not provide good fits to the SED. We computed additional grid of models with alternative vC/vSi values. The results confirm the conclusion of Sect. 4.1.1: all Si+C+H2O+porosity models lead to similarly good fits to the SED, as long as a sufficient fraction of carbon is considered. For instance, if silicates represent only 10% of the C+Si mixture, then vice remains at 0.65 and the porosity is reduced to 55%, with Mdust = 0.043 M⊕, amin = 0.89 μm and  . All these values remain within the uncertainties of the original model. Models involving carbon-poor grains do not provide good fits to the SED, but as long as vC/vSi ≳ 0.5, the results remain unchanged. In summary, the discrepancy between amin and ablow does not lie on the hypothesis we made on the composition of the grains.
Our estimation of ablow is based on the assumption that the grains are spherical and homogeneous, but the actual response of inhomogeneous aggregates to radiation pressure cannot be that simple. Saija et al. (2003) for instance show that the fluffiness of the grains tends to decrease their radiation pressure cross-section, as if aggregates behaved like their elemental constituents. This would make grains below the theoretical blowout size less sensitive to radiation pressure, and allow them to remain bound to the star. Thus the apparent inconsistency may be interpreted as another signpost of the complex structure of the grains. We emphasize that fixing amin as equal to ablow calculated with the (EMT-)Mie theory would not be a relevant approach when dealing with porous grains.
Another possibility is that grains are not in dynamical equilibrium (i.e. an imbalance between production and ejection), following for instance a major collisional event, such as an asteroid break-up. An excess of dust grains from all sizes would have been produced, including grains below the blowout size. These grains could have survived destructive collisions and radiation pressure blowing for long enough to be observed. Of course, observing such an event is unlikely, because dust typical lifetime is only of the order of 1000 years, which is small with comparison to the age of the star (see Sect. 7.2). But this “rare event hypothesis” would be consistent the scenario proposed by Chen et al. (2008) to justify the brightness asymmetry they claim to observe in thermal light.
7.2. Time scales and origin of the ice
Collisions occurring between grains in a debris disk are a key process as they generally result in the production of smaller dust particles, either by fragmentation of the target, or excavation. Any phenomenon longer than the characteristic collisional time scale will be considered negligible in the evolution of the dust population. Based on the principle that any particle will cross the disk midplane twice during one orbit, Thébault & Augereau (2007) proposed a simplified relation for the collisional time scale, valid for the smallest grains:  , with torbit the orbital period at the surface density peak, and
  the geometrical vertical optical depth. Here the orbital period at 89.5 AU is ~850 years, leading to tcol ~ 7600 years for the best model. This is more than three orders of magnitude smaller than the age of the system and two orders of magnitude smaller than the characteristic time-scale for Poynting-Robertson drag: tpr = 0.1 Myr for βpr = 1/2 grains (Wyatt 2008). The evolution of the HD 181327 debris disk is clearly dominated by collisions requiring a mechanism to generate dust on a 103−104 years characteristic time scale.
Attempts to model time-dependent chemistry with ProDiMo reveals that the grain water ice mantle would be photo-evaporated in a few hundred years (for ~1 μm grains), to a few thousand years (for ~10 μm grains), a similar (or shorter) time scale to the dust mutual collision, requiring as well an ice reprocessing mechanism. This provides a consistent view that the icy dust grains are maintained through collisions in a reservoir of icy planetesimals. We highlight that, while detecting the mid-infrared spectral features in the emission of a debris disk is very challenging – unambiguous detection have only been made in brighter circumstellar disks (see, e.g. Malfait et al. 1999) – the sole analysis of the continuum SED alone can provide clues on the amount of ice in dust disks, thus on the nature of the parent bodies, often referred to as the leftovers of planet formation.
In the solar system Kuiper belt, the study of icy planetesimals, Kuiper belt objects (KBOs) in particular, is a prolific topic (for a recent review see e.g. Jewitt 2010). The presence of ice, together with the porous nature of the objects, is inferred from estimates of their densities. Unambiguous detection of water ice has been made possible by the spectroscopic near-IR signature of crystalline ice, for instance by Delsanti et al. (2010) who completed their study of the plutino Orcus by radiative transfer considerations concluding that it contains a mixture dominated by amorphous and crystalline water ice. Confronted with space weathering, crystalline ice should be amorphidized in a short timescale. This implies that ice needs to be stored (and possibly produced) in the interior of the object before being brought to the surface, possibly through cryovolcanic events. The nature of water ice in KBOs remains unclear, but the vast majority of these objects are too small to experience such geological processes (Dumas et al. 2011,and references therein). Thus KBOs covered by crystalline ice can only constitute particular examples, and the water ice covering the collisionally produced dust in the solar system is more likely amorphous. The young age of HD 181327 allows the possibility that primordial crystalline ice has survived in its debris disk. Our study tilts in favor of the amorphous nature of that ice, suggesting that either ice was predominantly incorporated in an amorphous form in HD 181327’s Kuiper belt objects, or that the amorphization timescale is shorter than ~10 Myr in this distant belt.
8. Discussion
The properties of the HD 181327 debris disk can be compared to those of the disks surrounding two of its co-moving “sister” stars, β Pictoris (A3V, 1.7 M⊙) and AU Microscopii (M1V, 0.5 M⊙), which formed in the same molecular cloud from the same material and are coeval. Of course comparisons are limited by the specific models used to study each object. The relatively large porosity found here should be put in the context of the grain properties found for AU Mic (Graham et al. 2007; Fitzgerald et al. 2007). Assuming a Si+C+H2O mixture, only highly porous grains ( ), reproduces the scattered light profiles (exhibiting strong forward scattering), the high polarization and the thermal SED. In that model, the Mie theory remains valid to represent the scattering properties of porous grains, because the grains filling the outer disk are very small and stay in the Rayleigh regime. A total dust mass of 0.01 M⊕ is found, that essentially reflects the contribution from the inner mm-sized grains, concentrated in a ~40 AU belt. A similar porous grain model was used by Li & Greenberg (1998) to model β Pictoris yielding a dust mass ~0.4 M⊕, contained in the ~100 AU-wide outer disk. Overall, “cold coagulation-like” dust models prove effective at reproducing observations of these young debris disks. A trend appears for increasing dust mass with spectral type as could be intuitively expected, but despite this difference of scale, the three stars are orbited by a similar material.
Given the young age of these objects, we are investigating the conditions holding within disks just after the planetary embryos may have formed, the gas dispersed, and possible accretion onto outer giant planets happened. To explain the belt-like structure of the HD 181327 disk, the most straightforward explanation is to invoke the dynamical influence of a planet inside the belt. The Wisdom (1980) analytical criteria gives the width of the chaotic zone a planet mean-motion resonances would create. Assuming circular orbits for the planetesimals, as suggested by the sharpness of the belt, this yields a range of possible values for the planet semi-major axis depending on its mass. Assuming the inner edge of the disk is located at 78 AU from the star, the yet undiscovered planet would lie from 73 AU for a Neptune-mass planet, down to 59 AU for a 10 Jupiter-mass planet.
The material at that stage appears as very hydrated providing a considerable reservoir of water in the outer system. The existence of such a reservoir is hypothesized in scenarios of the solar system formation to explain the unexpectedly large water content on Earth for instance (Morbidelli et al. 2000). Indeed, terrestrial planets at this age (12 Myr) are likely too hot to hold on to water and later impacts of icy comet-like bodies from the outer regions are a possible mechanism for delivering water and volatiles to planets in the habitable zone. Thus, not only HD 181327’s debris disk reveals that the system has already grown planetary embryos – including maybe the bricks of rocky planets in the inner disk – but it likely holds the conditions that were prevailing before the solar system late heavy bombardment that depleted the Kuiper belt and determined terrestrial planets history.
9. Summary and conclusions
We have presented new Herschel/PACS and ATCA imaging of the HD 181327 debris disk, a 12 Myr old star belonging to the β Pictoris moving group. The 70 and 100 μm images as well as the 3.2 mm observation reveal a marginally resolved extended emission. Fluxes in the three PACS photometric channels were derived and complemented by continuum fluxes obtained from PACS spectroscopic observations. Together, these data provide precise information on the continuum thermal emission of the debris disk, but detailed models such as the one developed in this study are required to interpret the precise nature of the emitting material. Degeneracies between the grain properties and disk’s spatial structure are broken in our model by making use of a reprocessed HST/NICMOS coronagraphic image revealing that the dust is bound to a narrow belt peaking at 89.5 AU from the central star. We focus our study on the dust properties (composition, size distribution) using a radiative transfer code, and run a large grid of debris disk models for subsequent statistical (Bayesian) analysis. We conclude that the thermal light spectrum of the disk is well reproduced assuming a mixture of silicates, carbonaceous material and amorphous ice, as well as vacuum to mimic a significant porosity. The observed SED can be very reliably reproduced by a population of grains larger than ~1 μm, which follows a power-law distribution matching the ideal collisional equilibrium case and represents ~0.05 M⊕ (1.5 × 10⁻⁷ M⊙) in grains with sizes up to 1 mm. Extending the size distribution to the parent bodies of the observed dust grains leads to a mass of ~50 M⊕ for planetesimals up to 1 km. The composition we infer for the dust grains must be a good representation of a considerable reservoir of material hidden in unseen planetesimals.
In this study, we attempted to use Herschel/PACS spectroscopy to detect for the first time far-infrared emission lines in the debris disk. The non-detections we obtain were used to investigate the gas content of the debris disk with our photochemical disk model ProDiMo based on the dust model found with GRaTeR. The main uncertainty lies in the amount of PAHs in the disk. The current non-detections of [OI] and [CII] lines alone do not provide unambiguous upper limits to the gas content. Only in the case of a high PAH abundance, we can set an upper limit to the gas mass of ~17 M⊕ (one Neptune mass). Coupling with other tracers, in particular with the CO lines accessible to ALMA, offers much better prospects to reach lower limits on the low gas content of debris disks. However, steady-state chemistry is likely not ideally suited to debris disk modeling, and in future studies more appropriate prescriptions, time-dependent chemistry in particular, will be explored.
We note that both the low albedo estimated from the scattered light images and the dust dynamics are not well modelled by spherical grains filled with vacuum, and that the grains are likely complex fluffy aggregates. Though their thermal behavior is correctly described by the EMT-Mie theory, the scattering of light at short wavelengths and their sensitivity to radiation pressure require a more accurate description of the exact shape of the aggregates. Our statistical analysis highlights that ignoring the porosity of the grains or setting the minimum grain size as equal to the blowout size would result in incorrect interpretation of the observations, in particular because the grain opacity is strongly dependent on the exact grain composition.
We stress some necessary limitations of the models. First, we use a grain size distribution that is independent of the distance to the star, whereas it is known that only the smallest grains can populate the outer parts of the disk under the effect of radiation pressure. In this paper we discussed clues that the observed scattered light profile may not be a perfect representation of that seen in thermal light, by Herschel or ATCA. The long wavelength emission emanating from the largest grains might originate from an even narrower belt. Further studies will need to account for the radial differentiation of grain sizes with the objective to fit altogether resolved images from the near-IR to the millimetre domain. Secondly, the Dohnanyi-like power-law size distribution is known to be an insufficient description; if the real distribution implies wavy patterns as proposed by Thébault & Augereau (2007), then adjusting a power-law likely puts too many/too few small grains in the disk. Dynamical models are required to understand better the general outcome of the collisional evolution of the disk.
Herschel is an ESA space observatory with science instruments provided by European-led Principal Investigator consortia and with important participation from NASA.
The Australian Telescope Compact Array is operated by the Australian Telescope National Facility (ATNF) managed by CSIRO.
Available at http://herschel.esac.esa.int/AOTsReleaseStatus.shtml
The pointing accuracy of ATCA is ~1″.
Woitke et al. (2009) provide a detailed description of the code, with subsequent improvements described in Kamp et al. (2010), Thi et al. (2011), and Woitke et al. (2011).
The high PAH abundance is an upper-limit to the amount of PAHs in HerbigAe disks, where it is found to be of the order of 0.1–0.01 (e.g., Meeus et al. 2010, fPAH = 0.03 for HD 169142).
Note that, at longer wavelengths, the emission seems to falls-off faster than a simple power-law.
Acknowledgments
We wish to thank Paul Smith and Karl Stapelfeldt for their helpful comments regarding the Spitzer/MIPS-SED data, and Johan Olofsson for reducing the Spitzer/IRS spectrum. We are grateful to the anonymous referee who suggested improvement to the manuscript. We also thank the Programme National de Planétologie (PNP) and the CNES for supporting part of this research. J.L. and J.C.A. thank the French National Research Agency (ANR) for financial support through contract ANR-2010 BLAN-0505-01 (EXOZODI). This study is based, in part, on observations made with the NASA/ESA Hubble Space Telescope, obtained at the Space Telescope Science Institute (STScI), which is operated by the Association of Universities for Research in Astronomy, Inc., under NASA contract NAS 5-26555. These observations are associated with program # 10177. Support for program # 10177 was provided by NASA through a grant from the STScI.
References
- Augereau, J., & Beust, H. 2006, A&A, 455, 987 [NASA ADS] [CrossRef] [EDP Sciences] [Google Scholar]
- Augereau, J. C., Lagrange, A. M., Mouillet, D., Papaloizou, J. C. B., & Grorod, P. A. 1999, A&A, 348, 557 [NASA ADS] [Google Scholar]
- Augereau, J. C., Nelson, R. P., Lagrange, A. M., Papaloizou, J. C. B., & Mouillet, D. 2001, A&A, 370, 447 [NASA ADS] [CrossRef] [EDP Sciences] [Google Scholar]
- Bessell, M. S. 2000, PASP, 112, 961 [NASA ADS] [CrossRef] [Google Scholar]
- Bohren, C. F., & Huffman, D. R. 1983, Absorption and scattering of light by small particles (New York: Wiley) [Google Scholar]
- Carpenter, J. M., Wolf, S., Schreyer, K., Launhardt, R., & Henning, T. 2005, AJ, 129, 1049 [Google Scholar]
- Chen, C. H., Sargent, B. A., Bohac, C., et al. 2006, ApJS, 166, 351 [NASA ADS] [CrossRef] [Google Scholar]
- Chen, C. H., Fitzgerald, M. P., & Smith, P. S. 2008, ApJ, 689, 539 [NASA ADS] [CrossRef] [Google Scholar]
- Cieza, L., Padgett, D. L., Stapelfeldt, K. R., et al. 2007, ApJ, 667, 308 [NASA ADS] [CrossRef] [Google Scholar]
- Currie, T., & Sicilia-Aguilar, A. 2011, ApJ, 732, 24 [NASA ADS] [CrossRef] [Google Scholar]
- Dalgarno, A. 2006, Proc. National Academy of Science, 103, 12269 [NASA ADS] [CrossRef] [Google Scholar]
- Delsanti, A., Merlin, F., Guilbert, A., et al. 2010, A&A, 520, A40 [NASA ADS] [CrossRef] [EDP Sciences] [Google Scholar]
- Draine, B. T. 2003, ARA&A, 41, 241 [NASA ADS] [CrossRef] [Google Scholar]
- Draine, B. T. 2006, ApJ, 636, 1114 [NASA ADS] [CrossRef] [Google Scholar]
- Dumas, C., Carry, B., Hestroffer, D., & Merlin, F. 2011, A&A, 528, A105 [NASA ADS] [CrossRef] [EDP Sciences] [Google Scholar]
- Fitzgerald, M. P., Kalas, P. G., Duchêne, G., Pinte, C., & Graham, J. R. 2007, ApJ, 670, 536 [NASA ADS] [CrossRef] [Google Scholar]
- Golimowski, D. A., Krist, J. E., Stapelfeldt, K. R., et al. 2011, AJ, 142, 30 [NASA ADS] [CrossRef] [Google Scholar]
- Graham, J. R., Kalas, P. G., & Matthews, B. C. 2007, ApJ, 654, 595 [NASA ADS] [CrossRef] [Google Scholar]
- Greaves, J. S., & Wyatt, M. C. 2010, MNRAS, 404, 1944 [NASA ADS] [Google Scholar]
- Greenberg, J. M. 1998, A&A, 330, 375 [NASA ADS] [Google Scholar]
- Hartogh, P., Lis, D. C., Bockelée-Morvan, D., et al. 2011, Nature, 478, 218 [NASA ADS] [CrossRef] [PubMed] [Google Scholar]
- Hauschildt, P. H., Allard, F., Ferguson, J., Baron, E., & Alexander, D. R. 1999, ApJ, 525, 871 [NASA ADS] [CrossRef] [Google Scholar]
- Holmberg, J., Nordström, B., & Andersen, J. 2009, A&A, 501, 941 [NASA ADS] [CrossRef] [EDP Sciences] [Google Scholar]
- Jewitt, D. 2010, in IAU Symp. 263, ed. J. A. Fernández, D. Lazzaro, D. Prialnik, & R. Schulz, 3 [Google Scholar]
- Kamp, I., Tilling, I., Woitke, P., Thi, W., & Hogerheijde, M. 2010, A&A, 510, A18 [NASA ADS] [CrossRef] [EDP Sciences] [Google Scholar]
- Köhler, M., Mann, I., & Li, A. 2008, ApJ, 686, L95 [NASA ADS] [CrossRef] [Google Scholar]
- Krist, J. E., Stapelfeldt, K. R., Bryden, G., et al. 2010, AJ, 140, 1051 [NASA ADS] [CrossRef] [Google Scholar]
- Krivov, A. V. 2010, Res. Astron. Astrophys., 10, 383 [NASA ADS] [CrossRef] [Google Scholar]
- Lahuis, F., Kessler-Silacci, J. E., Evans, N. J., I., et al. 2006, c2d Spectroscopy Explanatory Supplement, Tech. Rep., Pasadena: Spitzer Science Center [Google Scholar]
- Li, A., & Greenberg, J. M. 1998, A&A, 331, 291 [NASA ADS] [Google Scholar]
- Li, A., & Lunine, J. I. 2003a, ApJ, 594, 987 [NASA ADS] [CrossRef] [Google Scholar]
- Li, A., & Lunine, J. I. 2003b, ApJ, 590, 368 [NASA ADS] [CrossRef] [Google Scholar]
- Mamajek, E. E., Meyer, M. R., Hinz, P. M., et al. 2004, ApJ, 612, 496 [NASA ADS] [CrossRef] [Google Scholar]
- Mannings, V., & Barlow, M. J. 1998, ApJ, 497, 330 [NASA ADS] [CrossRef] [Google Scholar]
- Mathews, G. S., Dent, W. R. F., Williams, J. P., et al. 2010, A&A, 518, L127 [NASA ADS] [CrossRef] [EDP Sciences] [Google Scholar]
- Meeus, G., Pinte, C., Woitke, P., et al. 2010, A&A, 518, L124 [NASA ADS] [CrossRef] [EDP Sciences] [Google Scholar]
- Moór, A., Ábrahám, P., Derekas, A., et al. 2006, ApJ, 644, 525 [NASA ADS] [CrossRef] [Google Scholar]
- Morbidelli, A., Chambers, J., Lunine, J. I., et al. 2000, Meteor. Planet. Sci., 35, 1309 [Google Scholar]
- Nilsson, R., Liseau, R., Brandeker, A., et al. 2009, A&A, 508, 1057 [NASA ADS] [CrossRef] [EDP Sciences] [Google Scholar]
- Nordström, B., Mayor, M., Andersen, J., et al. 2004, ApJ, 418, 989 [Google Scholar]
- Ott, S. 2010, in Astronomical Data Analysis Software and Systems XIX, ed. Y. Mizumoto, K.-I. Morita, & M. Ohishi, ASP Conf. Ser., 434, 139 [Google Scholar]
- Pilbratt, G. L., Riedinger, J. R., Passvogel, T., et al. 2010, A&A, 518, L1 [CrossRef] [EDP Sciences] [Google Scholar]
- Poglitsch, A., Waelkens, C., Geis, N., et al. 2010, A&A, 518, L2 [NASA ADS] [CrossRef] [EDP Sciences] [Google Scholar]
- Saija, R., Iatì, M. A., Giusto, A., et al. 2003, MNRAS, 341, 1239 [NASA ADS] [CrossRef] [Google Scholar]
- Sault, R. J., Teuben, P. J., & Wright, M. C. H. 1995, in Astronomical Data Analysis Software and Systems IV, ed. R. A. Shaw, H. E. Payne, & J. J. E. Hayes, ASP Conf. Ser., 77, 433 [Google Scholar]
- Schneider, G., Silverstone, M. D., Hines, D. C., et al. 2006, ApJ, 650, 414 [NASA ADS] [CrossRef] [Google Scholar]
- Shen, Y., Draine, B. T., & Johnson, E. T. 2009, ApJ, 696, 2126 [NASA ADS] [CrossRef] [Google Scholar]
- Thébault, P. 2009, A&A, 505, 1269 [NASA ADS] [CrossRef] [EDP Sciences] [Google Scholar]
- Thébault, P., & Augereau, J. 2007, A&A, 472, 169 [NASA ADS] [CrossRef] [EDP Sciences] [Google Scholar]
- Thi, W., Woitke, P., & Kamp, I. 2011, MNRAS, 412, 711 [NASA ADS] [Google Scholar]
- Voshchinnikov, N. V., Videen, G., & Henning, T. 2007, Appl. Opt., 46, 4065 [NASA ADS] [CrossRef] [PubMed] [Google Scholar]
- Warren, S. G. 1984, Appl. Opt., 23, 1206 [NASA ADS] [CrossRef] [PubMed] [Google Scholar]
- Wisdom, J. 1980, AJ, 85, 1122 [NASA ADS] [CrossRef] [Google Scholar]
- Woitke, P., Kamp, I., & Thi, W. 2009, A&A, 501, 383 [NASA ADS] [CrossRef] [EDP Sciences] [Google Scholar]
- Woitke, P., Riaz, B., Duchene, G., et al. 2011, A&A, 534, A44 [NASA ADS] [CrossRef] [EDP Sciences] [Google Scholar]
- Wyatt, M. C. 2008, ARA&A, 46, 339 [NASA ADS] [CrossRef] [Google Scholar]
- Zubko, V. G., Mennella, V., Colangeli, L., & Bussoletti, E. 1996, MNRAS, 282, 1321 [NASA ADS] [CrossRef] [Google Scholar]
- Zuckerman, B., & Song, I. 2004, ApJ, 603, 738 [NASA ADS] [CrossRef] [Google Scholar]
Appendix A: Statistical analysis of the results
The strength of the GRaTeR code, in comparison with an optimization algorithm that would provide a unique best-fit solution and possibly miss local minima, is that all the models are stored enabling fast and easy post-processing of the results.
To find the best solution in the grid of models, we use a classical least-square minimization approach with nfree = 3 to 4 free parameters depending on the grain composition and N = 48, which results in 43 to 45 degrees of freedom (d.o.f.) (Table 6). The free parameters are κ, amin and Mdust, and depending on the situation vC, vice or . Mdust is handled separately because it is automatically adjusted to reproduce the surface density profile in the code.
Gas line fluxes.
Let a be the vector of parameters. Here  . For each set of parameters, we can define the quantity:
 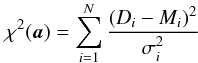 (A.1)where Di and Mi are the observed and modeled values, respectively, and σi is the measured uncertainty. For each χ2 value, we can define the likelihood of the data, i.e. the probability of the data given the parameters of a model. This assumes the errors are distributed normally and are uncorrelated.
 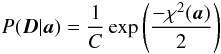 (A.2)where C is a normalization constant and D = {D(i)} i = 1...N. In order to evaluate the effect of each individual parameter ai on the quality of the fit, we implement a Bayesian inference method. We define the posterior probability of a as the probability distribution of the parameters a given the data D. It has to be noted that this formulation implicitly assumes that the model is suited to describe the observation. Bayes’ theorem says that this quantity can be written:
 (A.3)where P(D) is the prior probability of the data under all possible hypothesis (a normalization constant in practice), and P(a) is the prior probability distribution of the parameters a. Here we use uniform priors for all the parameters, meaning that we do not favor any realization of the parameters prior to obtaining the data. That fundamental theorem provides a simple way to independently assess the parameters of a model. Indeed, the marginal probability of each parameter ai can be computed regardless of the values of the other parameters aj ≠ i:
  (A.4)Then we obtain a probability law as a function of the realization of each individual parameter. Finally, we estimate the parameters by calculating the mathematical expectation and variance. These are the values presented in Table 6 where the uncertainties are 3σ,
Appendix B: Gas line fluxes (see Table B.1.)
All Tables
Parameter space explored with Grater , corresponding to a total of about 1 150 000 models.
Best-fitting (Best, i.e. lowest ) and most probable (Proba, i.e. highest probability) parameters assuming different grain compositions (see text for the definition of the parameters).
All Figures
|
Fig. 1 PACS 70 μm imaging of (left) HD 181327 and (right) a PSF reference star, HD 148387. Both images were acquired in chop-nod mode. The field of view of each image is 25″ × 25″. Brightness contours at 5, 10, 25, 50 and 75 times the background noise in the HD 181327 image are overlaid on both images. |
| In the text | |
|
Fig. 2 Radial profiles of HD 181327 at 70 μm (top), compared to HD 148387 as a PSF reference, and at 100 μm (bottom), compared to α Boo as a PSF reference. Both plots show the azimuthally averaged, normalized radial brightness profile vs. radius from the star. Each error bar is the standard deviation of the brightness values at that radius. The FWHM values for the profiles are given on the plot. |
| In the text | |
|
Fig. 3 ATCA 93.969 GHz (3.192 mm) map of HD 181327 with contours at −2 (dashed red line), 2 and 3σ (solid blue lines), where σ is the image rms given by 1.1 × 10⁻⁴ Jy/beam. The dashed blue area represents the beam. The Gaussian fit is overplot with contours at 2 and 3σ (solid green lines). The red and green crosses denote respectively the star position and the Gaussian fit center. |
| In the text | |
|
Fig. 4 PACS spectrum of HD181327, centered on the wavelength of the [O i] 63 μm emission line. The linear fit to the continuum flux is overplotted with the red line. The [O i] 63 μm emission line was not detected. |
| In the text | |
|
Fig. 5 New HST/NICMOS 1.1 μm surface brightness profiles (top, nominal and ±1σ profiles), and surface density profiles resulting from direct inversion of the brightness profiles (bottom), assuming two possible values for the asymmetry parameter. The color-coding is the same for both panels. The striped areas identify regions dominated by PSF-substraction residuals where the density has been extrapolated. |
| In the text | |
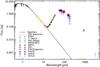 |
Fig. 6 Observed spectral energy distribution of HD 181327 (see Tables 2–4). |
| In the text | |
|
Fig. 7 Mass opacity of spherical grains computed with the Mie theory and Bruggeman mixing rule for several prototypical compositions detailed in Table 6 and their associated best-fit size distributions. |
| In the text | |
|
Fig. 8 Best fit models (Table 6) for several 1- or 2-material mixtures (top) and 3- to 4-material mixtures (bottom). Red crosses: photometric data (Fig. 6). Solid grey line: synthetic stellar spectrum. |
| In the text | |
|
Fig. 9 Bayesian probabilities for the models in Table 6: minimum grain size, size distribution power law index, and total dust mass. |
| In the text | |
|
Fig. 10 Bayesian probabilities for the grain composition in the case of 4-material dust mixtures. |
| In the text | |
|
Fig. 11 Expected gas line fluxes as a function of gas-to-solid mass ratio for either a low-PAH abundance (thin lines) or a high-PAH abundance (thick lines). The horizontal lines denote the PACS 3σ upper-limits and do not include the 30% flux calibration uncertainty. The gas-to-solid mass ratios assume a solid mass of 0.164 M⊕. |
| In the text | |
|
Fig. 12 βpr = |FP |/| FG| as a function of grain radius. The horizontal dashed line denotes the limit between bound (β < 1/2) and unbound (β > 1/2) grains. |
| In the text | |
Current usage metrics show cumulative count of Article Views (full-text article views including HTML views, PDF and ePub downloads, according to the available data) and Abstracts Views on Vision4Press platform.
Data correspond to usage on the plateform after 2015. The current usage metrics is available 48-96 hours after online publication and is updated daily on week days.
Initial download of the metrics may take a while.