Fig. 2
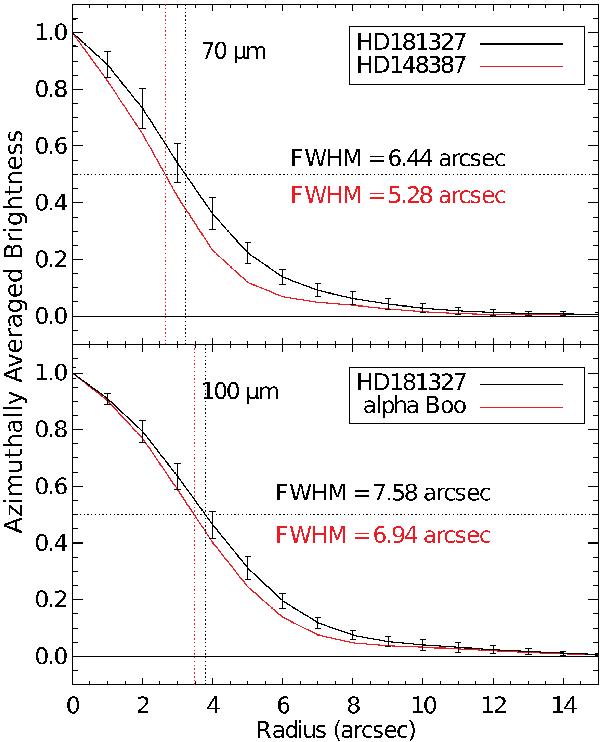
Radial profiles of HD 181327 at 70 μm (top), compared to HD 148387 as a PSF reference, and at 100 μm (bottom), compared to α Boo as a PSF reference. Both plots show the azimuthally averaged, normalized radial brightness profile vs. radius from the star. Each error bar is the standard deviation of the brightness values at that radius. The FWHM values for the profiles are given on the plot.
Current usage metrics show cumulative count of Article Views (full-text article views including HTML views, PDF and ePub downloads, according to the available data) and Abstracts Views on Vision4Press platform.
Data correspond to usage on the plateform after 2015. The current usage metrics is available 48-96 hours after online publication and is updated daily on week days.
Initial download of the metrics may take a while.