| Issue |
A&A
Volume 537, January 2012
|
|
|---|---|---|
| Article Number | L9 | |
| Number of page(s) | 4 | |
| Section | Letters | |
| DOI | https://doi.org/10.1051/0004-6361/201118612 | |
| Published online | 18 January 2012 | |
Chemical differentiation toward the Pipe nebula starless cores
1 Institut de Ciències de l’Espai (CSIC-IEEC), Campus UAB, Facultat de Ciències, Torre C5p, 08193 Bellaterra, Catalunya, Spain
e-mail: frau@ice.cat; girart@ice.cat
2 INAF-Osservatorio Astrofisico di Arcetri, Largo Enrico Fermi 5, 50125 Firenze, Italy
e-mail: mbeltran@arcetri.astro.it
Received: 8 December 2011
Accepted: 22 December 2011
We use the new IRAM 30-m FTS backend to perform an unbiased ~15 GHz wide survey at 3 mm toward the Pipe nebula young diffuse starless cores. We discover an unexpectedly rich chemistry. We propose a new observational classification based on the 3 mm molecular line emission normalized by the core visual extinction (AV). On the basis of this classification, we report a clear differentiation between cores in terms of chemical composition and line emission properties, which enables us to define three molecular core groups. The “diffuse” cores, AV ≲ 15, have a poor chemistry with mainly simple species (e.g. CS and C2H). The “oxo-sulfurated” cores, AV ≃ 15–22, appear to be abundant in species such as SO and SO2, but also in HCO, which seem to disappear at higher densities. Finally, the “deuterated” cores, AV ≳ 22, have a typical evolved chemistry prior to the onset of the star formation process, with nitrogenated and deuterated species, as well as carbon chain molecules. On the basis of these categories, one of the “diffuse” cores (core 47) has the spectral line properties of the “oxo-sulfurated” ones, which suggests that it is a failed core.
Key words: stars: formation / ISM: lines and bands / ISM: individual objects: Pipe nebula
© ESO, 2012
1. Introduction
A new generation of sensitive receivers and wideband backends allows the detailed study of the chemistry of faint starless cores. Several surveys have been performed toward them reporting a rich but relatively simple chemistry consisting of essentially carbon with significant sulfur and nitrogen bearing molecules, in addition to later deuteration that can be used as a chemical clock (e.g., Turner 1994; Turner et al. 2000; Hirota & Yamamoto 2006; Tafalla et al. 2006; Bergin & Tafalla 2007). From the theoretical side, several papers have tried to model the starless core chemistry self-consistently (Aikawa et al. 2001; Garrod et al. 2005; Keto & Caselli 2008).
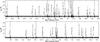 |
Fig. 1 IRAM 30-m EMIR+FTS full bandwidth spectrum toward core 12. The most important detected molecular transitions are labeled within the plot. The upper and lower panels show the ~7.6 GHz lower and upper sidebands, respectively. The noise rarely exceeds 10 mK. The negative emission are the twin negative counterparts of the positive emission due to the frequency-switching observing mode. |
The Pipe nebula is a nearby (145 pc: Alves & Franco 2007) cloud that harbors more than one hundred low-mass (~1 M⊙) starless cores, most of them gravitationally unbound but confined by the thermal/magnetic pressure of the whole cloud (Alves et al. 2008; Lada et al. 2008; Franco et al. 2010). The Pipe nebula differs from the other nearby dark cloud complexes such as Taurus or ρ Ophiuchus because it has a very low star formation efficiency (Onishi et al. 1999; Forbrich et al. 2009; Román-Zúñiga et al. 2010, 2012). Thus, the Pipe nebula is an ideal target for studying the physical and chemical conditions in a pristine environment prior to the onset of the star formation process, as numerous studies have shown (e.g., Brooke et al. 2007; Muench et al. 2007; Rathborne et al. 2008). Frau et al. (2010) presented the first results of an extensive continuum and molecular line study of a subset of a selected sample of cores distributed in the different regions of the Pipe nebula: bowl, stem, and B59. The cores are in general less dense and less chemically evolved than starless cores in other star forming regions that have been studied (e.g. Crapsi et al. 2005). We find very different morphologies and densities, and no clear correlation of the chemical evolutionary stage of the cores with their location in the cloud. The Pipe nebula starless cores have been shown to be more heterogeneous than expected.
In this work, we present a wide (~15 GHz) unbiased chemical survey at 3 mm toward a larger sample of Pipe nebula starless cores, spanning a factor of six in their visual extinction (AV) peaks. This is a first step in characterizing their varied chemistry before proceeding to in-depth modeling in the future.
2. FTS observations and data reduction
We performed pointed observations toward the Pipe nebula cores 06, 08, 12, 14, 20, 33, 40, 47, 48, 56, 65, 87, 102, and 109, following the numbering of Rathborne et al. (2008), and toward a position with no cores. We pointed either toward the continuum emission peak (Frau et al. 2010), if available, or toward the C18O pointing center reported by Muench et al. (2007). We assumed that the pointing centers were the densest region of the cores, hence have the richest chemistry. We used the EMIR heterodyne receiver of the IRAM 30-m telescope tuned at the C2H (1–0) transition (87.3169 GHz). At this frequency, the telescope delivers  , Beff = 0.81, and Feff = 0.95. The observations were carried out in August 2011, when we were the first astrophysicists to use the FTS spectrometer as the spectral backend. We selected a channel resolution of 195 kHz ( ≃ 0.6 km s-1 at 3 mm), which provided a total bandwidth of 14.86 GHz covering the frequency ranges from 82.01 to 89.44 GHz, and from 97.69 to 105.12 GHz. We used the frequency-switching mode with a frequency throw of 7.5 MHz. System temperatures ranged from ~110 K to ~150 K. The accuracy of the pointing was checked every two hours. We reduced the data using the CLASS package of the GILDAS1 software. The baseline in the frequency switching mode for such a large bandwidth (~3.7 GHz for each chunk) has a complicated shape with sinusoidal-like ripples. Nevertheless, since the observed lines are very narrow (≲0.5 km s-1, similar to the effective spectral resolution), the baselines can be efficiently removed if narrow frequency windows are used (≲20 MHz). The resulting typical rms noise was ≃ 8 mK at the 195 kHz spectral resolution.
3. Results
The large width of the available bandwidth, 14.86 GHz, has allowed us to carry out an unbiased survey, covering about a third of the observable 3 mm window. We used the Splatalogue2 tool to identify possible lines. We considered as tentative detections those lines with intensities in the 3–5σ range, and fiducial detections those higher than 5σ. We detected 53 transitions from a total of 31 molecules (including isotopologues). In Fig. 1, we indicate the observed bandwidth toward core 12 and the main molecular species. Most of the detected lines were identified in this core, the one with the highest AV and the brightest molecular line emission of the sample. However, there are a few sulfur-bearing molecular lines that were not detected toward core 12 but found to be present in other cores: SO2 31,3–20,2, 34SO 32–21, and OCS 7–6. We reported tentative detections (~4σ) of HOCO+ (cores 6 and 102), l-C3H (cores 12 and 109), and HCCNC (core 12). In all the cores, we also identified several Earth atmospheric lines, mostly from ozone.
The cores with the brightest detected lines are those with the highest AV (cores 12, 87 and 109) owing to their larger gas column densities. To avoid a column density bias (our core sample spans a factor of six in AV), we normalized the intensity by dividing the spectra by the AV peak of the core. We used the values obtained by Román-Zúñiga et al. (2010) from dust extinction maps that have an angular resolution similar to our observations. This definition is similar to that of molecular abundance for optically thin lines. Figure 2 shows a selected sample of the brightest normalized lines toward all of the sample, with the cores ordered by their AV peak. In this figure, we ordered the molecules into families taking into account their atomic composition.
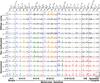 |
Fig. 2 Selected normalized molecular transitions toward the observed cores. The scale is shown in the bottom right spectrum. The normalized intensity axis ranges from –0.33 to 1, while the velocity axis spans 20 km s-1 centered at the vLSR. Rows: individual cores, labeled on the left-hand side of the figure, ordered by its AV peak. Columns: molecular transition, ordered by molecular families, labeled on the top of the figure. The spectra have been divided by [AV/100 mag] to mimic the abundance, where the AV value is that at the respective core center (Román-Zúñiga et al. 2010) given below the core name. Each molecular transition has been multiplied by a factor, given below its name, to fit in a common scale. Colors are used to highlight the distinctive emission of the different core groups: blue for ubiquitous lines, green dense-medium molecular transitions, orange molecular transitions typical in oxo-sulfurated cores (see Sect. 4), red molecular transitions typical in deuterated cores, and black mostly undetected species. |
In general, the 3 mm transitions of the lightest species of most of the molecular families (blue spectra in Fig. 2) were detected in all the cores of our sample: C2H, HCO+, CS, SO, and HCN. The molecule c–C3H2 was detected in all but two cores. The 3 mm main transitions of these molecules can be assumed to be “ubiquitous lines” in starless cores. The molecular transitions HCO+ 1–0, CS 2–1, and HCN 1–0 display little variations in normalized intensity. These molecules have large dipole moments and high abundances, hence are likely to have large optical depths. In addition, the HCO+ 1–0 and HCN 1–0 transitions can be affected by absorption by low density foreground gas (Girart et al. 2000). Indeed, the relative HCN 1-0 hyperfine line intensities of cores 12, 40, and 87 suggest that this transition is out of LTE. The normalized intensities of the other three ubiquitous lines show significant variations within the sample. However, while C2H 1–0 and c–C3H2 21,2–10,1 tend to increase with AV, the SO 32–21 line appears to have the largest normalized intensities in the cores with visual extinction in the range of 15 to 22 mag.
Several molecular transitions were only detected toward cores with AV ≳ 15. The optically thin H13CO+ 1–0 and HC18O+ 1–0 transitions, and the transition HNCO 40,4–30,3, have larger normalized intensities with increasing column densities. The detected transitions from oxo-sulfurated molecules (SO 22–11, 34SO 32–21, SO2 31,3–20,2, and OCS 7–6) are detected mainly toward the cores with the brightest SO 32–21 emission, that is, mainly in the cores with AV ≃ 15–22 mag. The HCO 1–0 transition exhibits the same behavior. Despite its low density (AV = 11.2 mag), core 47 displays emission in most of the oxo-sulfurated molecular transitions as well as in HCO 1–0. The H2CS 31,3–21,2 transition appears to show a similar trend to the oxo-sulfurated molecules, although it peaks at slightly denser cores (for which AV ≃ 20 mag) and clearly survives at larger AV values. The emission of the other two lines of this group, HCS+ 2–1 and 13C18O 1–0, is too weak to show a clear trend.
The number of detected molecular transitions increased significantly for the four cores with the highest column density (AV ≳ 22 mag) owing to either (i) excitation/column density reasons or (ii) the length of the synthesization timescales. The c–C3H2 molecule is a good example of the former molecules. Although ubiquitous in the 21,2–10,1 transition, the 31,2–30,3 one is only detected at these column densities. The rarer isotopologic counterparts of the HCN and c–C3H2 1–0 ubiquitous lines (H13CN, HC15N, and c–H13CCCH) are detected only in these four cores. This is also the case for HN13C and H15NC in the 1–0 transition, which suggests that the HNC 1–0 is also likely to be an ubiquitous line. Most of the transitions detected in these four cores have higher normalized intensities with increasing AV (e.g. HC3N 11–10). The carbon-chain molecular transitions (C4H 9–8 and 11–10, and CH3C2H 5n–4n and 6n–5n) are the exception, displaying little variations in normalized intensity. We also detected several transitions of three deuterated forms of abundant species, namely C3HD 30,3–21,2, NH2D 1–1, and DC3N in the 9–8 and 12–11 (see Fig. 2). Only the first transition is detected in the four cores.
4. Discussion and conclusions
The chemistry detected toward the sample of fourteen starless cores is unexpectedly rich taking into account their low temperatures (10–15 K: Rathborne et al. 2008) and visual extinctions. The apparent correlation within the sample of the 3 mm molecular transition normalized intensities to visual extinction allow us to propose an observational classification (see Fig. 2). We have defined three groups of starless cores, which are probably related to their dynamical age: “diffuse”, “oxo-sulfurated”, and “deuterated” cores. This classification can be useful in future wide band 3 mm observations of molecular clouds.
The first group consists of so-called “diffuse” cores, a set of cores with small column densities (AV ≲ 15 mag ~ NH2 ≲ 1.2 × 1022 cm-2) lies above the blue dot-dashed horizontal line in Fig. 2. Their spectra is rather poor, showing only significant normalized intensity in the transitions of the main isotopologues of abundant species such as C2H, HCN (and likely HNC), HCO+, and SO. Such a simple observational chemistry suggests that these are very young starless cores, or even transient clumps for which essentially the cloud chemistry is more clearly detected owing to density enhancements. Core 47 is a clear exception as we have discussed later in the main paper text.
Our second are the “oxo-sulfurated” cores, which are denser cores (AV ≃ 15–22 mag ~ NH2 ≃ 1.2 × 10²²–1.7 × 1022 cm-2) that have a richer chemistry for which no significant deuteration has been observed. In Fig. 2, this group lies between the blue dot-dashed and red dashed horizontal lines. All the transitions detected in the “diffuse” cores are also present. The SO 32–21 transition is the main signpost as it is very bright. Many other oxo-sulfurated molecules (34SO, SO2, and OCS), as well as HCO, exhibit a similar trend but are not detected at higher densities. This suggests that there has been an increase in the abundances of these chemically related species in the gas-phase in this AV range, followed by a later depletion/destruction as density increases. These cores might be in-the-making cores, which have developed a richer chemistry and piled up more material, probably in a stage close to the onset of collapse (Ruffle et al. 1999). Core 102 is an exception in this group as we have discussed later in the text.
Our third of “deuterated” cores are the densest in our sample (AV  22 mag ~ NH2 1.7 × 1022 cm-2), and shown below the red dashed horizontal line in Fig. 2. Core 12, the densest one, sets the upper limit at AV = 67.2 mag (NH2 ≃ 5.3 × 1022 cm-2). These cores are generally bright in the transitions typical of the other two groups. The oxo-sulfurated molecules are the exception, because they are hardly present and probably depleted/destructed at the densities reached. The main signpost is the emission that is only present in this group, in rare isotopologues of the nitrogenated ubiquitous lines (H13CN, HC15N, HN13C, and H15NC), deuterated forms of abundant species (C3HD, NH2D, and DC3N), and carbon-chain molecules (C4H and CH3C2H). These cores might be stable starless cores with a life-time long enough to achieve the densities needed to synthesize efficiently carbon chains and deuterated species (Roberts & Millar 2000; Gwenlan et al. 2000).
As we have previously noted, core 47 does not share the chemical properties of the diffuse cores. It has a similar chemistry to the oxo-sulfurated group, which proved to be very sensitive to density. This suggests that it might be a failed core that has developed a rich chemistry and is now merging back into the cloud. This scenario is consistent with the high abundances of oxo-sulfurated species (Garrod et al. 2005). Core 47 is located close to core 48 in the only Pipe nebula
region with superalfvénic turbulence, as shown by optical polarization observations (Franco et al. 2010). Therefore, it is possible that an external source of turbulence is disrupting the medium in this area and dispersing the cores.
In contrast, core 102, in the oxo-sulfurated group, has a similar chemistry to that of the diffuse cores. Similarly, core 87, among the deuterated cores, has similar features to the oxo-sulfurated group. This suggests that these cores might have piled up material so rapidly that a more complex chemistry had no time to be synthesized. Both cores lie in the same N-S oriented high-density structure (Román-Zúñiga et al. 2010) where Franco et al. (2010) reported a N-S magnetic field. This rapid evolution might have been driven by magnetic fields with the surrounding mass collapsing in this direction.
Our FTS chemical survey toward the starless cores of the Pipe nebula has demonstrated that it has a chemistry far richer than expected for a cloud giving birth to low-mass stars at very low efficiency. A fully consistent interpretation of the results would require chemical modeling to investigate the possible evolutionary tracks, and will be the purpose of a forthcoming study.
Available at http://www.iram.fr/IRAMFR/GILDAS
Acknowledgments
P.F. is partially supported by MICINN fellowship FPU (Spain). P.F., J.M.G. and M.T.B. are supported by MICINN grant AYA2008-06189-C03 (Spain). P.F., J.M.G., and M.T.B. are also supported by AGAUR grant 2009SGR1172 (Catalonia). We thank Carlos Román-Zúñiga for kindly providing their AV maps. The authors wish to acknowledge all the IRAM 30-m staff for their hospitality during the observing runs, the operators, and the AoDs for their active support. We thank the anonymous referee for useful comments. This research has made use of NASA’s Astrophysics Data System.
References
- Aikawa, Y., Ohashi, N., Inutsuka, S.-I., et al. 2001, ApJ, 552, 639 [NASA ADS] [CrossRef] [Google Scholar]
- Alves, F. O., & Franco, G. A. P. 2007, A&A, 470, 597 [NASA ADS] [CrossRef] [EDP Sciences] [Google Scholar]
- Alves, F. O., Franco, G. A. P., & Girart, J. M. 2008, A&A, 486, L13 [NASA ADS] [CrossRef] [EDP Sciences] [Google Scholar]
- Bergin, E. A., & Tafalla, M. 2007, ARA&A, 45, 339 [NASA ADS] [CrossRef] [Google Scholar]
- Brooke, T., Huard, T. L., Bourke, T. L., et al. 2007, ApJ, 655, 364 [NASA ADS] [CrossRef] [Google Scholar]
- Crapsi, A., Caselli, P., Walmsley, C. M., et al. 2005, ApJ, 619, 379 [Google Scholar]
- Forbrich, J., Lada, C. J., Muench, A. A., et al. 2009, ApJ, 704, 292 [NASA ADS] [CrossRef] [Google Scholar]
- Franco, G. A. P., Alves, F. O., & Girart, J. M. 2010, ApJ, 723, 146 [Google Scholar]
- Frau, P., Girart, J. M., Beltrán, M. T., et al. 2010, ApJ, 723, 1665 [NASA ADS] [CrossRef] [Google Scholar]
- Garrod, R. T., Williams, D. A., Hartquist, T. W., et al. 2005, MNRAS, 356, 654 [NASA ADS] [CrossRef] [Google Scholar]
- Girart, J. M., Estalella, R., Ho, P. T. P., & Rudolph, A. L. 2000, ApJ, 539, 763 [NASA ADS] [CrossRef] [Google Scholar]
- Gwenlan, C., Ruffle, D. P., Viti, S., et al. 2000, A&A, 354, 1127 [NASA ADS] [Google Scholar]
- Hirota, T., & Yamamoto, S. 2006, ApJ, 646, 258 [NASA ADS] [CrossRef] [Google Scholar]
- Keto, E., & Caselli, P. 2008, ApJ, 683, 238 [NASA ADS] [CrossRef] [Google Scholar]
- Lada, C. J., Muench, A. A., Rathborne, J. M., et al. 2008, ApJ, 672, 410 [NASA ADS] [CrossRef] [Google Scholar]
- Muench, A. A., Lada, C. J., Rathborne, J. M., et al. 2007, ApJ, 671, 1820 [NASA ADS] [CrossRef] [Google Scholar]
- Onishi, T., Kawamura, A., Abe, R., et al. 1999, PASJ, 51, 871 [Google Scholar]
- Rathborne, J. M., Lada, C. J., Muench, A. A., et al. 2008, ApJS, 174, 396 [NASA ADS] [CrossRef] [Google Scholar]
- Roberts, H., & Millar, T. J. 2000, A&A, 361, 388 [NASA ADS] [Google Scholar]
- Román-Zúñiga, C., Alves, J. F., Lada, C. J., & Lombardi, M. 2010, ApJ, 725, 2232 [NASA ADS] [CrossRef] [Google Scholar]
- Román-Zúñiga, C., Frau, P., Girart, J. M., & Alves, J. F. 2012, ApJ, accepted [Google Scholar]
- Ruffle, D. P., Hartquist, T. W., Caselli, P., & Williams, D. A. 1999, MNRAS, 306, 691 [NASA ADS] [CrossRef] [Google Scholar]
- Tafalla, M., Santiago-García, J., Myers, P. C., et al. 2006, A&A, 455, 577 [NASA ADS] [CrossRef] [EDP Sciences] [Google Scholar]
- Turner, B. E. 1994, ApJ, 420, 661 [NASA ADS] [CrossRef] [Google Scholar]
- Turner, B. E., Herbst, E., & Terzieva, R. 2000, ApJS, 126, 427 [NASA ADS] [CrossRef] [Google Scholar]
All Figures
|
Fig. 1 IRAM 30-m EMIR+FTS full bandwidth spectrum toward core 12. The most important detected molecular transitions are labeled within the plot. The upper and lower panels show the ~7.6 GHz lower and upper sidebands, respectively. The noise rarely exceeds 10 mK. The negative emission are the twin negative counterparts of the positive emission due to the frequency-switching observing mode. |
| In the text | |
|
Fig. 2 Selected normalized molecular transitions toward the observed cores. The scale is shown in the bottom right spectrum. The normalized intensity axis ranges from –0.33 to 1, while the velocity axis spans 20 km s-1 centered at the vLSR. Rows: individual cores, labeled on the left-hand side of the figure, ordered by its AV peak. Columns: molecular transition, ordered by molecular families, labeled on the top of the figure. The spectra have been divided by [AV/100 mag] to mimic the abundance, where the AV value is that at the respective core center (Román-Zúñiga et al. 2010) given below the core name. Each molecular transition has been multiplied by a factor, given below its name, to fit in a common scale. Colors are used to highlight the distinctive emission of the different core groups: blue for ubiquitous lines, green dense-medium molecular transitions, orange molecular transitions typical in oxo-sulfurated cores (see Sect. 4), red molecular transitions typical in deuterated cores, and black mostly undetected species. |
| In the text | |
Current usage metrics show cumulative count of Article Views (full-text article views including HTML views, PDF and ePub downloads, according to the available data) and Abstracts Views on Vision4Press platform.
Data correspond to usage on the plateform after 2015. The current usage metrics is available 48-96 hours after online publication and is updated daily on week days.
Initial download of the metrics may take a while.