Fig. 1
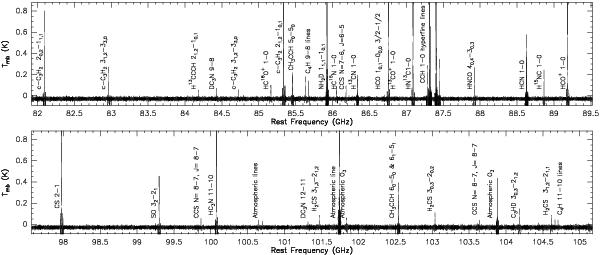
IRAM 30-m EMIR+FTS full bandwidth spectrum toward core 12. The most important detected molecular transitions are labeled within the plot. The upper and lower panels show the ~7.6 GHz lower and upper sidebands, respectively. The noise rarely exceeds 10 mK. The negative emission are the twin negative counterparts of the positive emission due to the frequency-switching observing mode.
Current usage metrics show cumulative count of Article Views (full-text article views including HTML views, PDF and ePub downloads, according to the available data) and Abstracts Views on Vision4Press platform.
Data correspond to usage on the plateform after 2015. The current usage metrics is available 48-96 hours after online publication and is updated daily on week days.
Initial download of the metrics may take a while.