Fig. 2
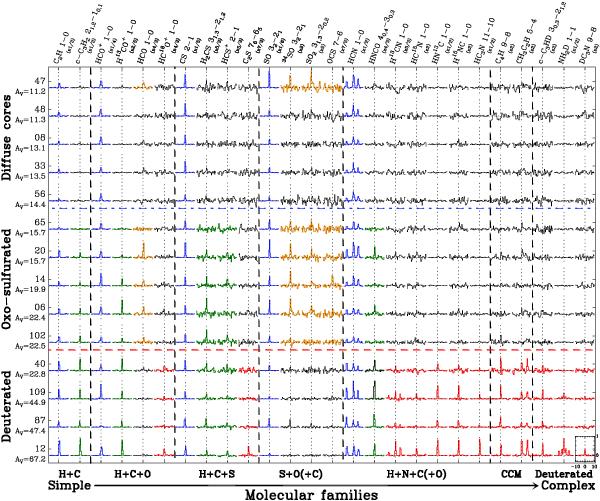
Selected normalized molecular transitions toward the observed cores. The scale is shown in the bottom right spectrum. The normalized intensity axis ranges from –0.33 to 1, while the velocity axis spans 20 km s-1 centered at the vLSR. Rows: individual cores, labeled on the left-hand side of the figure, ordered by its AV peak. Columns: molecular transition, ordered by molecular families, labeled on the top of the figure. The spectra have been divided by [AV/100 mag] to mimic the abundance, where the AV value is that at the respective core center (Román-Zúñiga et al. 2010) given below the core name. Each molecular transition has been multiplied by a factor, given below its name, to fit in a common scale. Colors are used to highlight the distinctive emission of the different core groups: blue for ubiquitous lines, green dense-medium molecular transitions, orange molecular transitions typical in oxo-sulfurated cores (see Sect. 4), red molecular transitions typical in deuterated cores, and black mostly undetected species.
Current usage metrics show cumulative count of Article Views (full-text article views including HTML views, PDF and ePub downloads, according to the available data) and Abstracts Views on Vision4Press platform.
Data correspond to usage on the plateform after 2015. The current usage metrics is available 48-96 hours after online publication and is updated daily on week days.
Initial download of the metrics may take a while.