| Issue |
A&A
Volume 537, January 2012
|
|
|---|---|---|
| Article Number | L7 | |
| Number of page(s) | 4 | |
| Section | Letters | |
| DOI | https://doi.org/10.1051/0004-6361/201118474 | |
| Published online | 16 January 2012 | |
The first outburst of the black-hole candidate MAXI J1836−194 observed by INTEGRAL, Swift, and RXTE
1 ISDC Data Centre for Astrophysics, Chemin d’Écogia 16, 1290 Versoix, Switzerland
e-mail: This email address is being protected from spambots. You need JavaScript enabled to view it.
2 IASF-Roma, INAF, via Fosso del Cavaliere 100, 00152 Rome, Italy
Received: 17 November 2011
Accepted: 22 December 2011
Abstract
MAXI J1836−194 is a transient black-hole candidate discovered in outburst on 30 August 2011. We report on the available INTEGRAL, Swift, and RXTE observations performed in the direction of the source during this event before 55 864 MJD. Combining the broad band (0.6–200 keV) spectral and timing information obtained from these data with the results of radio observations, we show that the event displayed by MAXI J1836−194 is another example of “failed” outburst. During the first ~20 days after the onset of the event, the source underwent a transition from the canonical low/hard to the hard intermediate state, while reaching the highest X-ray flux. In the ~40 days following the peak of the outburst, the source displayed a progressive spectral hardening and a decrease in the X-ray flux, thus it entered again the low/hard state and began its return to quiescence.
Key words: methods: observational / X-rays: binaries / X-rays: individuals: MAXI J1836-194
© ESO, 2012
1. Introduction
MAXI J1836−194 was discovered in outburst by MAXI/GSC (Mihara et al. 2011) on 30 August 2011 (55 803 MJD), and detected simultaneously also with the BAT (Barthelmy et al. 2005) on-board Swift (Gehrels et al. 2004). At discovery, the flux of the source was 25 mCrab and 40 mCrab in the energy ranges 4–10 keV and 15–50 keV, respectively (Negoro et al. 2011). The analysis of previous MAXI/GSC data suggested that the outburst might have already started on 55 802 MJD. Follow-up observations with Swift /XRT and Swift /UVOT on 55 803.7 MJD provided the best estimated position so far (RA = 18h35m43.43s; Dec = –19d19m12.1s, J2000; associated uncertainty 1.8 arcsec at 90% c.l.) and led to the identification of the optical counterpart (Kennea et al. 2011). An RXTE /PCA observation was performed on 55 804.5 MJD (Strohmayer & Smith 2011), and permitted a classification of the source as a new black-hole candidate (BHC) possibly undergoing a transition from the low-hard (LHS) to the hard intermediate state (HIMS; see, e.g. Belloni 2010, for a recent review). Relatively strong radio and infrared emissions from the source were detected from 55 806 MJD to 55 827 MJD (Miller-Jones et al. 2011; Trushkin et al. 2011) and are likely associated with the presence of a jet.
In this paper we report on all available INTEGRAL, Swift /XRT, and RXTE /PCA data collected during the outburst of the source from 55 804 to 55 864 MJD.
2. INTEGRAL and Swift data
MAXI J1836 − 194 was detected by IBIS/ISGRI from 55 816.9 MJD to 55 850.4 MJD, corresponding to the satellite revolutions from 1088 to 1099. These observations belong to various guest observer program including the Galactic Bulge monitoring (Kuulkers et al. 2007, http://integral.esac.esa.int/BULGE/). During this period, the source was simultaneously observed in the smaller field of view (FOV) of the two JEM-X units only for a limited amount of time (see Table 1). INTEGRAL data analysis was carried out by using version 9.0 of the OSA software distributed by the ISDC (Courvoisier et al. 2003). We used time bins of about three days for spectra and light curves, i.e., one satellite revolution, since no variability was detectable on shorter timescales. In Table 1, we report the spectral results only for those INTEGRAL observations in which quasi-simultaneous Swift data were available so that a broad-band fit could be carried out. We present the IBIS/ISGRI count rate in the 20–100 keV energy range in the lowest panel of Fig. 1, to show the spectral softening around 55 820 MJD and the subsequent hardening during the outburst decay.
We analyzed all Swift /XRT observations performed in window timing mode (WT) from 55 804.7 MJD to 55 863.6 MJD. Data analysis was carried out with the technique described by Bozzo et al. (2009). In the present case, we selected only grade 0 events and limited our spectral analysis to the range 0.6–10 keV to avoid known calibration problems1. A systematic uncertainty of 3% was added to the spectra with the highest fluxes2.
Quasi-simultaneous Swift /XRT, JEM-X, and IBIS/ISGRI spectral fits.
The XRT light curves of the source in the 0.3–4 keV and 4–10 keV energy bands, together with the corresponding hardness ratio (HR), are reported in Fig. 1. None of the XRT spectra extracted before 55 850 MJD could be satisfactorily fit by using an absorbed PL component. The residuals from these fits demonstrated the presence of an additional soft spectral component below ~4 keV. A better fit to the data was obtained by adding a disk blackbody component (diskBB in Xspec). The XRT spectra extracted after 55 850 MJD did not require the soft component and could be well fitted by using an absorbed PL (see Fig. 1).
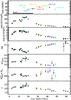 |
Fig. 1 From top to bottom. INTEGRAL /ISGRI count rate of the source in the 20–100 keV energy range (the Crab yields about 220 cts/s in this band). Colors and labels indicate the time intervals used for the joint XRT+JEM-X+ISGRI fits reported in Table 1. We also mark in this panel the radio coverage (Trushkin et al. 2011). Swift /XRT lightcurve of the source (time bin 1 ks) in two energy bands (0.3–4 keV and 4–10 keV) and the corresponding HR. Evolution of the temperature and squared root of the normalization constant (proportional to the disk inner radius) of the diskBB component and PL photon index. |
We performed a joint fit of all available quasi-simultaneous XRT+ISGRI data to investigate the broad-band (0.6–200 keV) spectral properties of the source (see Fig. 2). The results of this analysis are reported in Table 1 (throughout the paper uncertainties are estimated at 90% c.l.). When available, we included in the fit the spectra extracted from the two JEM-X units. A normalization constant on the order of unity was introduced to account for the variability of the source and inter-calibration issues between the different instruments. Every broad-band spectrum could be reasonably well fitted by using an absorbed diskBB+PL model. No high-energy exponential roll-over was observable: a lower limit on the cut-off energy could be generally set at ~200 keV, with the exception of the spectrum 1099+26, for which the relatively poor statistics of the data yields a less constraining lower limit of 53 keV.
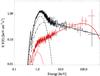 |
Fig. 2 Broad-band spectrum of MAXI J1836 − 194 obtained by using data from XRT, ISGRI, JEM-X1 and JEM-X2 (the model comprises PL and diskBB components). We show in black the data 1090+13 (see Table 1) of the outburst peak. Red points are from the observations 1099+26 at the end of the outburst and are modeled introducing an exponential roll-over with Ec = 150 keV. |
3. RXTE data
RXTE /PCA observations (55 804.5–55 864 MJD) were analyzed with standard tecniques, as described in Ferrigno et al. (2011). We used only data from the PCU2 because this was always active throughout the outburst of MAXI J1836 − 194 (observations ID 96438 and 96371; total exposure time 62 ks).
The spectral analysis was performed using the standard2 mode data in the energy range 8–40 keV, as the contamination from the Galactic ridge prevented an accurate characterization of the source spectral emission properties at lower energies (we relied on XRT data for the energy range 0.6–8 keV). In the considered energy range, the PCA spectrum could be modeled by a power-law with Γ ~ 1.5–2.0 (see Fig. 3, upper panels). The PL photon index increased (Γ ≃ 1.7–1.9) during the earlier phases of the outburst (55 803–55 817 MJD, blue diamonds), became steeper (Γ ≃ 2.0) around the peak of the outburst (55 817–55 822 MJD, black dots), decreased until 55 838 MJD, and remained roughly constant afterwards. The flux of this PL component was suppressed at the outburst peak (black dots), increased during the spectral hardening until ~55 832 MJD (green stars), and finally decreases steadily (red triangles). These results agree fairly well with those obtained from Swift and INTEGRAL.
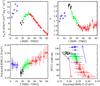 |
Fig. 3 Upper panels: spectral model parameters obtained from the PCA data in the 8–40 keV energy range; FPL(8 − 40 keV) is the 8–40 keV flux in units of 10-10 erg s-1 cm-2, Γ the PL photon index. Different symbols mark in all panels the three phases of the oubursts discussed in Sect. 3. Bottom left panel: fractional rms computed from the background subtracted RXTE/PCA light curves in the 2–25 keV energy range as a function of time. Bottom right panel: fractional rms vs. intensity. The average count rate is background-subtracted and refers to PCU2. Arrows indicate temporal evolution. |
The timing analysis was performed using the GoodXenon events in the energy range 2–25 keV. Power spectra (PSD) were calculated using powspec v1.0 during intervals of 64 s, averaged together, and geometrically rebinned. In preliminary runs, we used 2-10 s time bins and verified that above ~30 Hz the signal was always consistent with white noise. The latter, also corrected for the dead-time contribution, was subtracted from the final PSD, which we computed from the background-corrected light curves binned at 2-6 s. We averaged the PSDs in long intervals corresponding to the different phases of the outburst and verified that the PSD of the single observations within these intervals presented similar characteristics. As shown in Fig. 4, all PSDs are characterized by a flat-top, band-limited noise that can be described using Lorentzian curves (Fig. 4). The PSD is dominated by two broad components whose centroid frequencies move coherently throughout the outburst in rough correlation with the source flux. In the early phase of the outburst (55 804–55 814 MJD) the lower component peaks at ~0.5 Hz, while at the maximum of the outburst (55 818–55 822 MJD) it moves to ~1 Hz. We note that the higher frequency component splits at the outburst peak into narrower features centered at 5.0 ± 0.1 Hz and 8.4 ± 0.6 Hz, with quality factors of 5 ± 1 and 3 ± 1, respectively (fractional rms of ~8%, uncertainties at 1σ). Integrating the PSD on shorter intervals, we were unable to verify wether these features are produced by narrower peaks moving in frequency, owing to the limited statistics. At the later phases, we averaged the PSD over the intervals 55 823–55 833 MJD and 55 833–55 848 MJD to study possible variations of the PSD, to show a progressive decrease of the noise peak frequency (we neglected the following observations because of the lower S/N).
In the lower panels of Fig. 3, we show the integrated fractional rms computed from the background-subtracted light curves using bins of 2-4 s as 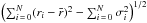 /
/ (ri is the rate in the i-th bin with error σi, N = 2048 is the number of bins, and
  is the mean count rate). The rms of each observation and the corresponding uncertainty was estimated from the average and standard deviation of the values determined in each 64 s long time intervals. The fractional rms remains above 21% at the early and late stages of the outburst, while it is slightly suppressed (~18%) at the peak (black dots)3.
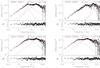 |
Fig. 4 Four PSDs extracted from the RXTE/PCA observations of MAXI J1836−194 (see Sect. 3). The red solid line is the best-fit model obtained from the sum of the Lorentzian curves plotted as dashed lines. Residuals form the fit are shown below each PSD. |
4. Discussion
When undergoing an outburst, BHC sources usually follow a relatively well known “q-track” pattern in the HID (see Fig. 5; Fender et al. 2004; Homan & Belloni 2005; Belloni 2010). The outburst starts in the so-called low-hard spectral state (LHS), which is characterized by a power-law shaped X-ray spectrum with Γ ≃ 1.4–1.5 and a cut-off at the higher energies (Ecut ~ 100 keV). A soft thermal component with kT < 0.5 keV is often observed in the LHS and ascribed to the emission from an accretion disk truncated at long distances from the central BH (~100 km; Done et al. 2007). The radio emission in this state is caused by the synchrotron radiation of a steady jet. During the early rise of the outburst, the X-ray and radio luminosities both increase, but the X-ray color of the spectrum remains hard (Corbel et al. 2000, 2003). As the outburst progresses, the source reaches the high-soft state (HSS) characterized by a prominent thermal emission from the accretion disk and a marginal power law tail. In addition to these two main states, Homan & Belloni (2005) identify the hard-intermediate (HIMS) and soft-intermediate (SIMS) states with spectral parameters of the disk and power-law component in between the LHS and HSS. We will exploit this classification in the remainder of this discussion. An alternative division of the source intermediate states was used, e.g., by Remillard & McClintock (2006), who define a steep power-law state (Γ > 2.4) generally observed at high flux and then also known as very high state, plus an intermediate state that covers the unclassified observations. We stress that both SIMS and HSS are characterized by the absence of radio emission. This is interpreted as the suppression of the jet and marks the most striking difference between the soft and hard states. The short timescale variability also varies during the outbursts. The level of the rms noise decreases with increasing flux in the LHS and decreases even more when leaving this state. Band-limited noise is then suppressed and quasi-periodical oscillations (QPOs) make their appearance (see e.g., Homan & Belloni 2005; van der Klis 2006; Remillard & McClintock 2006; Belloni 2010). Not all transient BHCs in outburst go through a complete q-track. So far, a limited number of objects were observed to start an outburst, reach the HIMS, but then return to the LHS instead of moving to HSS (Capitanio et al. 2009).
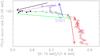 |
Fig. 5 Hardness intensity diagram (HID) of MAXI J1836 − 194 obtained from the RXTE/PCA background-subtracted average spectra of each observation. Symbols refer to the same intervals as in Fig. 3, arrows indicate temporal evolution. |
The available data of the 2011 outburst of MAXI J1836 − 194 suggest that this event represents another example of these “failed” outbursts. As summarized in Sect. 1, the initial observations of the source carried out with MAXI indicate that the onset of the outburst occurred probably on 55 802 MJD. Spectral and timing information on the source were first available through Swift/XRT and RXTE/PCA observations in the interval 55 803–55 814 MJD, showing characteristics typical of the end of LHS: a relatively hard power-law photon index increasing from ~1.7 to 2.0, a relatively high rms (~23%, Fig. 3), and a marginally significant QPO corresponding to the break frequency of the PSD. A soft diskBB component was detected in the XRT spectrum, with a temperature ~0.3 keV, i..e, comparable with that expected from a truncated accretion disk in LHS (Done et al. 2007).
During the following bright phase of the outburst (55 815–55 822 MJD), the diskBB accounts for about half the broad-band X-ray flux (Fig. 2) with an increased temperature of ~0.4 keV and a roughly halved squared root of normalization, which indicates a smaller inner truncation radius of the disk (Fig. 1 and Table 1). Correspondingly, the power-law steepens (Γ ~ 2) consistently with a more efficient cooling of a population of high-energy electrons, which up-scatter the soft disk photons and produce the high-energy non-thermal emission (see, e.g., Zdziarski et al. 2002, and references therein). These properties indicate a transition to the HIMS, which is confirmed by a decrease of the fractional rms to ~18%, the higher frequency extension of the broad-band noise, and the appearance of blandly coherent noise at a few Hertz. The latter often evolves into QPOs with high quality factors during the HIMS (see, e.g., Homan & Belloni 2005); this is not observed for MAXI J1836−194. A transition to the SIMS is excluded by the absence of a clear drop in the rms to a few percent (see Fig. 3) and by radio detection of the source from ~55 806 to ~55 827 MJD (this argues against any possible disappearence of the jet, as expected in the transition HIMS-SIMS; Trushkin et al. 2011).
After 55 823 MJD, MAXI J1836−194 underwent a relatively rapid flux decrease, a significant spectral hardening and an increase of the fractional rms (see Fig. 3). The hard X-ray flux as measured by RXTE/PCA resumed during the first part of the decay (until ~55 832 MJD) and then decayed at roughly constant spectral slope. Correspondingly, the temperature of the thermal component decreased to ~0.2 keV (Fig. 1) and its normalization increased: this can be interpreted, within the disk truncated model, as the inner radius moving away from the BH. Swift data collected in the period from 48 to 61 days after the onset of the event did not show evidence for the soft spectral component probably because of the limited and short exposure time of the Swift/XRT data and/or a very low disk temperature. In this phase, the PL photon index remained virtually constant at Γ ≃ 1.6, and the source became fainter down to an X-ray flux of 3 × 10⁻¹⁰ erg cm-2 s-1.
The HID of MAXI J1836 − 194 showed in Fig. 5 also supports these conclusions: the source was first observed during the transition from the LHS to HIMS (blue diamonds). It remained in the HIMS for a few days (black dots). It then slowly moved back to the LHS (green stars) and then faded out (red triangles). Based on the timing and spectral properties of the RXTE, Swift, and INTEGRAL data, we conclude that MAXI J1836 − 194 is one of the few black-hole candidates, together with H 1743 − 322 in 2008 and SAX J1711.6 − 3808 in 2001 (see Capitanio et al. 2009, and references therein), which showed a transition to the HIMS, but did not enter a soft state.
We checked that similar results would have been obtained from the timing analysis of the XRT observations, though with larger uncertainties owing to the limited statistics of the data.
Acknowledgments
M.D.S. and F.C. acknowledge financial contribution from the agreement ASI-INAF I/009/10/0. M.D.S. acknowledges the grant from PRIN-INAF 2009 (PI: L. Sidoli). We thank P. Casella for sharing his experience in interesting discussions.
References
- Barthelmy, S. D., Barbier, L. M., Cummings, J. R., et al. 2005, Space Sci. Rev., 120, 143 [NASA ADS] [CrossRef] [Google Scholar]
- Belloni, T. M. 2010, in The Jet Paradigm, Lecture Notes in Physics (Berlin, Heidelberg: Springer Verlag), 794, 53 [Google Scholar]
- Bozzo, E., Giunta, A., Stella, L., et al. 2009, A&A, 502, 21 [NASA ADS] [CrossRef] [EDP Sciences] [Google Scholar]
- Capitanio, F., Belloni, T., Del Santo, M., & Ubertini, P. 2009, MNRAS, 398, 1194 [NASA ADS] [CrossRef] [Google Scholar]
- Corbel, S., Fender, R. P., Tzioumis, A. K., et al. 2000, A&A, 359, 251 [NASA ADS] [Google Scholar]
- Corbel, S., Nowak, M. A., Fender, R. P., et al. 2003, A&A, 400, 1007 [NASA ADS] [CrossRef] [EDP Sciences] [Google Scholar]
- Courvoisier, T., Walter, R., Beckmann, V., et al. 2003, A&A, 411, L53 [NASA ADS] [CrossRef] [EDP Sciences] [Google Scholar]
- Done, C., Gierliński, M., & Kubota, A. 2007, A&AR, 15, 1 [Google Scholar]
- Fender, R. P., Belloni, T. M., & Gallo, E. 2004, MNRAS, 355, 1105 [NASA ADS] [CrossRef] [Google Scholar]
- Ferrigno, C., Bozzo, E., Falanga, M., et al. 2011, A&A, 525, A48 [NASA ADS] [CrossRef] [EDP Sciences] [Google Scholar]
- Gehrels, N., Chincarini, G., Giommi, P., et al. 2004, ApJ, 611, 1005 [NASA ADS] [CrossRef] [Google Scholar]
- Homan, J., & Belloni, T. 2005, Ap&SS, 300, 107 [NASA ADS] [CrossRef] [Google Scholar]
- Kennea, J. A., Hoversten, E. A., Siegel, M. H., et al. 2011, The Astronomer’s Telegram, 3613, 1 [NASA ADS] [Google Scholar]
- Kuulkers, E., Shaw, S. E., Paizis, A., et al. 2007, A&A, 466, 595 [NASA ADS] [CrossRef] [EDP Sciences] [Google Scholar]
- Mihara, T., Nakajima, M., Sugizaki, M., et al. 2011, Publ. Astron. Soc. Jap., 63, 623 [Google Scholar]
- Miller-Jones, J. C. A., Sivakoff, G. R., Rupen, M., et al. 2011, The Astronomer’s Telegram, 3628, 1 [NASA ADS] [Google Scholar]
- Negoro, H., Nakajima, M., Nakahira, S., et al. 2011, The Astronomer’s Telegram, 3611, 1 [Google Scholar]
- Remillard, R. A., & McClintock, J. E. 2006, ARA&A, 44, 49 [NASA ADS] [CrossRef] [Google Scholar]
- Strohmayer, T. E., & Smith, E. A. 2011, The Astronomer’s Telegram, 3618, 1 [NASA ADS] [Google Scholar]
- Trushkin, S. A., Nizhelskij, N. A., Zhekanis, G. V., et al. 2011, The Astronomer’s Telegram, 3656, 1 [NASA ADS] [Google Scholar]
- van der Klis, M. 2006, in Compact stellar X-ray sources, ed. W. Lewin, & M. van der Klis, Cambridge Astrophysics Series (Cambridge, UK: Cambridge University Press), 39 [Google Scholar]
- Zdziarski, A. A., Poutanen, J., Paciesas, W. S., & Wen, L. 2002, ApJ, 578, 357 [NASA ADS] [CrossRef] [Google Scholar]
All Tables
All Figures
|
Fig. 1 From top to bottom. INTEGRAL /ISGRI count rate of the source in the 20–100 keV energy range (the Crab yields about 220 cts/s in this band). Colors and labels indicate the time intervals used for the joint XRT+JEM-X+ISGRI fits reported in Table 1. We also mark in this panel the radio coverage (Trushkin et al. 2011). Swift /XRT lightcurve of the source (time bin 1 ks) in two energy bands (0.3–4 keV and 4–10 keV) and the corresponding HR. Evolution of the temperature and squared root of the normalization constant (proportional to the disk inner radius) of the diskBB component and PL photon index. |
| In the text | |
|
Fig. 2 Broad-band spectrum of MAXI J1836 − 194 obtained by using data from XRT, ISGRI, JEM-X1 and JEM-X2 (the model comprises PL and diskBB components). We show in black the data 1090+13 (see Table 1) of the outburst peak. Red points are from the observations 1099+26 at the end of the outburst and are modeled introducing an exponential roll-over with Ec = 150 keV. |
| In the text | |
|
Fig. 3 Upper panels: spectral model parameters obtained from the PCA data in the 8–40 keV energy range; FPL(8 − 40 keV) is the 8–40 keV flux in units of 10-10 erg s-1 cm-2, Γ the PL photon index. Different symbols mark in all panels the three phases of the oubursts discussed in Sect. 3. Bottom left panel: fractional rms computed from the background subtracted RXTE/PCA light curves in the 2–25 keV energy range as a function of time. Bottom right panel: fractional rms vs. intensity. The average count rate is background-subtracted and refers to PCU2. Arrows indicate temporal evolution. |
| In the text | |
|
Fig. 4 Four PSDs extracted from the RXTE/PCA observations of MAXI J1836−194 (see Sect. 3). The red solid line is the best-fit model obtained from the sum of the Lorentzian curves plotted as dashed lines. Residuals form the fit are shown below each PSD. |
| In the text | |
|
Fig. 5 Hardness intensity diagram (HID) of MAXI J1836 − 194 obtained from the RXTE/PCA background-subtracted average spectra of each observation. Symbols refer to the same intervals as in Fig. 3, arrows indicate temporal evolution. |
| In the text | |
Current usage metrics show cumulative count of Article Views (full-text article views including HTML views, PDF and ePub downloads, according to the available data) and Abstracts Views on Vision4Press platform.
Data correspond to usage on the plateform after 2015. The current usage metrics is available 48-96 hours after online publication and is updated daily on week days.
Initial download of the metrics may take a while.