Fig. 1
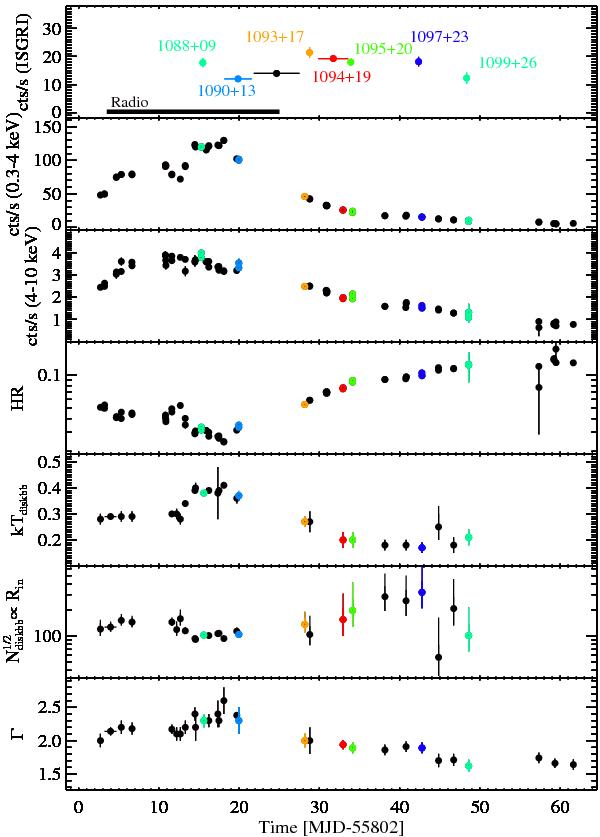
From top to bottom. INTEGRAL /ISGRI count rate of the source in the 20–100 keV energy range (the Crab yields about 220 cts/s in this band). Colors and labels indicate the time intervals used for the joint XRT+JEM-X+ISGRI fits reported in Table 1. We also mark in this panel the radio coverage (Trushkin et al. 2011). Swift /XRT lightcurve of the source (time bin 1 ks) in two energy bands (0.3–4 keV and 4–10 keV) and the corresponding HR. Evolution of the temperature and squared root of the normalization constant (proportional to the disk inner radius) of the diskBB component and PL photon index.
Current usage metrics show cumulative count of Article Views (full-text article views including HTML views, PDF and ePub downloads, according to the available data) and Abstracts Views on Vision4Press platform.
Data correspond to usage on the plateform after 2015. The current usage metrics is available 48-96 hours after online publication and is updated daily on week days.
Initial download of the metrics may take a while.