Fig. 3
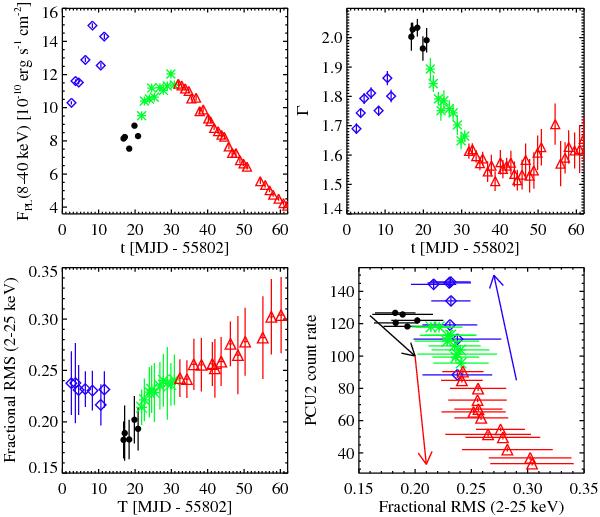
Upper panels: spectral model parameters obtained from the PCA data in the 8–40 keV energy range; FPL(8 − 40 keV) is the 8–40 keV flux in units of 10-10 erg s-1 cm-2, Γ the PL photon index. Different symbols mark in all panels the three phases of the oubursts discussed in Sect. 3. Bottom left panel: fractional rms computed from the background subtracted RXTE/PCA light curves in the 2–25 keV energy range as a function of time. Bottom right panel: fractional rms vs. intensity. The average count rate is background-subtracted and refers to PCU2. Arrows indicate temporal evolution.
Current usage metrics show cumulative count of Article Views (full-text article views including HTML views, PDF and ePub downloads, according to the available data) and Abstracts Views on Vision4Press platform.
Data correspond to usage on the plateform after 2015. The current usage metrics is available 48-96 hours after online publication and is updated daily on week days.
Initial download of the metrics may take a while.