Free Access
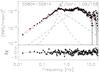
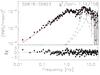
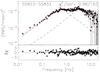
Fig. 4
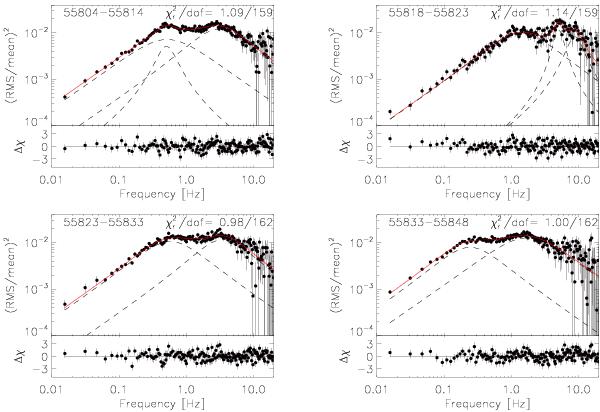
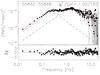
Four PSDs extracted from the RXTE/PCA observations of MAXI J1836−194 (see Sect. 3). The red solid line is the best-fit model obtained from the sum of the Lorentzian curves plotted as dashed lines. Residuals form the fit are shown below each PSD.
This figure is made of several images, please see below:
Current usage metrics show cumulative count of Article Views (full-text article views including HTML views, PDF and ePub downloads, according to the available data) and Abstracts Views on Vision4Press platform.
Data correspond to usage on the plateform after 2015. The current usage metrics is available 48-96 hours after online publication and is updated daily on week days.
Initial download of the metrics may take a while.