| Issue |
A&A
Volume 537, January 2012
|
|
|---|---|---|
| Article Number | A87 | |
| Number of page(s) | 11 | |
| Section | Extragalactic astronomy | |
| DOI | https://doi.org/10.1051/0004-6361/201117974 | |
| Published online | 12 January 2012 | |
Hard X-ray spectral variability of the brightest Seyfert AGN in the Swift/BAT sample
1 Foundation for Research and Technology-Hellas, IESL, Voutes, 71110 Heraklion, Crete, Greece
e-mail: This email address is being protected from spambots. You need JavaScript enabled to view it.
2 Physics Department, University of Crete, 710 03 Heraklion, Crete, Greece
3 University of Crete, Department of Physics and Institute of Theoretical & Computational Physics, University of Crete, 710 03 Heraklion, Crete, Greece
4 Osservatorio Astronomico di Roma-INAF, via di Frascati 33, 00040 Monte Porzio Catone, RM, Italy
5 Harvard-Smithsonian Center for Astrophysics, 60 Garden Street, Cambridge, MA 02138, USA
6 SLAC National Laboratory and Kavli Institute for Particle Astrophysics and Cosmology, 2575 Sand Hill Road, Menlo Park, CA 94025, USA
Received: 30 August 2011
Accepted: 28 October 2011
Abstract
Aims. We analyse data from a 58 month long, continuous Swift/Burst Alert Telescope (BAT) series of observations of the five brightest Seyfert galaxies at hard X-rays, to study their flux and spectral variability in the 20–100 keV energy band. The column density in these objects is less than 1024 cm-2, which implies that the Swift/BAT data allow us to study the “true” variability of the central source.
Methods. We used 2-day binned light curves in the (20–50) and (50–100) keV bands to estimate their fractional variability amplitude, and the same band 20-day binned light curves to compute hardness ratios and construct “colour-flux” diagrams. We also considered a thermal Comptonization model, together with a reflection component with constant flux, and produced model “colour-flux” diagrams, assuming realistic variations in the model parameter values, which we then compared with the observed diagrams.
Results. All objects show significant variations, with an amplitude that is similar to the AGN variability amplitude at energies below 10 keV. We found evidence of an anti-correlation between variability amplitude and black hole mass. The light curves in both bands are well-correlated with each other, with no significant delays on time scales as short as two days. We find that both NGC 4151 and NGC 2110 display no spectral variability, but that there is a significant anti-correlation between hardness ratios and source flux in NGC 4388 (and NGC 4945, IC 4329, to a lesser extent). This “softer when brighter” behaviour is similar to that observed at energies below 10 keV, and cannot be explained if the continuum varies only in flux; the intrinsic shape should also steepen with increasing flux.
Conclusions. The detection of significant flux variations indicate that the central source in these objects is intrinsically variable on time scales as short as ~1−2 days. The intrinsic slope of the continuum varies with the flux (at least in NGC 4388). The positive “spectral slope-flux” correlation can be explained if the temperature of the hot corona decreases with increasing flux. The lack of spectral variations in two objects (NGC 4151 and NGC 2110) might indicate that they are in a different “state”, as their accretion rate is less than 1% of the Eddington limit (significantly lower than the rate of the other three objects in the sample).
Key words: accretion, accretion disks / black hole physics / galaxies: Seyfert / X-rays: galaxies
© ESO, 2012
1. Introduction
Active galactic nuclei (AGN) are the most prominent and persistent of X-ray sources in the sky. The presently most popular paradigm for the explaining the emission from the central sources in these objects is that they contain a central black hole (BH) with a mass of 106−109 M⊙, and a geometrically thin, optically thick accretion disc that may extend to the innermost stable circular orbit around the black hole. Current unification schemes for radio-quiet AGN also postulate that there is an obscuring molecular torus around the central source that prevents any direct view of the continuum and broad-line region in Seyfert 2 galaxies. The accretion disc is thought to be responsible for the broad, quasi-thermal emission component in the optical-UV spectrum of AGN (the so-called “big blue bump”). At energies above ~2 keV, a power-law like component is observed in radio-quiet AGN. This is attributed to emission by a hot corona (T ~ 108 − 109 K) overlying the thin disc. The corona up-Comptonizes the disc soft photons to produce the hard (E ~ 2−200 keV) X-ray emission. X-rays from the corona can also illuminate the disc, producing the Fe Kα line (6.4–6.97 keV) and the “reflection hump” at higher energies (George & Fabian 1991). Reflection of the central radiation from the molecular torus often leads to an additional, possibly dominant, reflection component (Ghisellini et al. 1994).
The AGN X-ray emission is strongly variable, even on time scales as short as a few hundred seconds, in terms of the flux and the shape of the observed energy spectrum. In most cases, radio-quiet objects show a positive spectral slope-flux relation, i.e. a softer-when-brighter behaviour, in the 2–10 keV band on both short and long time scales (see e.g. Sobolewska & Papadakis 2009, and references therein). From a theoretical perspective, intrinsic slope variations are expected (Haardt et al. 1997; Coppi 1999; Beloborodov 1999). For example, in the case of thermal Comptonization models, variations in the UV/soft X-ray photons can affect the slope of the X-ray spectrum and result in “softer” X-ray spectra when the source is bright. These variations may indeed have already been observed (see e.g. Nandra et al. 2000; Petrucci et al. 2000).
On the other hand, it has been argued that this apparent spectral steepening with increasing source flux in the 2–10 keV band does not necessarily represent an intrinsic change in the spectral slope. These variations might occur when the power-law continuum is variable in flux, but not in shape, and the reflection component of the spectrum is constant. In this case, the superposition of this constant (in flux and shape) component and the continuum emission, of constant spectral slope and variable normalisation, can result in spectral softening as the flux increases (see e.g. Taylor et al. 2003; Ponti et al. 2006; Miniutti et al. 2007). Furthermore, an absorber for which either the column density, the ionisation state and/or the covering factor of the source varies, can also produce the observed spectral variations in the 2–10 keV band of the radio-quiet AGN (see e.g. Turner & Miller 2009, for a review). Some cases of extreme absorption variations have indeed been reported in Seyfert galaxies, with NGC 1365 being the most prominent case (Risaliti et al. 2005, 2007, 2009).
To avoid the effects of variable absorption on the shape of the X-ray spectrum it is clearly most appropiate to study the “hard” X-ray emission (i.e. X-rays at energies higher than ~20 keV). At these energies, only neutral absorbers with a column density higher than 1024 cm-2 can affect the shape of the intrinsic spectrum. Apart from these cases (which correspond to the so-called “Compton” thick sources), hard X-ray light curves can in principle allow the study of the intrinsic continuum variability in AGN. A number of observations in hard X-rays have been performed the past twenty years by CGRO, BeppoSAX and INTEGRAL. The Swift/BAT all-sky survey in particular has provided us with continuously sampled light curves, which span periods as long as five years, for many AGN.
Beckmann et al. (2007) presented the results of their study of the first nine months of Swift/BAT light curves of 44 AGN. They found that ~30% of Seyferts exhibit significant hard X-ray variability on time scales of 20–150 days, that type 1 Seyferts are less variable than Seyferts 2, and that there is a significant anti-correlation between luminosity and variability amplitude. Soldi et al. (2010) reported the results of a preliminary study of the flux variability of 36 AGN using data from the first five years of Swift/BAT observations. Their results confirmed the hard X-ray variability – luminosity anti-correlation detected by Beckmann et al. (2007) at high energies. They also showed that an anti-correlation between variability amplitude and BH mass may also exist for Seyfert galaxies.
In this paper, we present the results of our variability study of the five brightest radio-quiet AGN from the catalogue of Baumgartner et al. (2011), using five years of BAT light curve data that the same authors provide in the 20–50 and 50–100 keV bands (the “soft” and “hard” bands, hereafter). Our main aim is to study the spectral variability of the sources with the use of “hardness ratios”, i.e. by simply dividing the hard by the soft-band light curves. These ratios have been extensively used to the study the AGN spectral variability in the 2–10/20 keV band. Their greatest advantage is that they are entirely model-independent; if the hardness ratios are variable, then the spectral shape of the source has to be variable, irrespective of the underlying continuum spectrum and the spectral component responsible for the observed variations. In addition, the presence (or absence) of a correlation between the hardness ratios and the source flux can indicate which model components vary (or not) in AGN.
We restricted our study to the five brightest Seyferts in the current Swift/BAT catalogue because they are bright enough to permit an accurate estimation of their soft and hard band fluxes on time scales as short as 20 days. As a result, we are able to use the hardness ratios to search for low-amplitude spectral variations on these time scales, almost continuously, over a period of five years. This would not be possible to achieve by studying energy spectra extracted over periods as short as ~one month, owing to the low signal-to-noise ratio (S/N) of the data. In addition, the S/N of even the 1–2 day binned soft-band light curves of these objects is high enough to study their flux variations over a broad range of time scales, i.e. from years down to almost a day.
The sample and the light curves we used are described in Sect. 2. Our results from the flux and spectral variability analysis are reported in Sects. 3 and 4. We discuss possible implications of our results in Sect. 5, and we present our conclusions in Sect. 5.
2. The sample and data analysis
The Burst Alert Telescope (BAT; Barthelmy et al. 2005) on-board the Swift (Gehrels et al. 2004) is sensitive to X-ray photons in the 14–195 keV energy range. Baumgartner et al. (2011) released a catalogue of sources detected in the first 58 months of BAT observations. It consists of 1092 sources, detected at a significance level of at least 4.8σ. The majority of the sources in this catalogue are AGN (with 519 objects classified as Seyferts). We chose to study the five Seyferts that have the highest flux in this Swift BAT 58-Month Hard X-ray Survey catalogue, among all radio-quiet AGN. Source names and their hard X-ray fluxes are listed in Table 1. A summary of previous findings, regarding the hard X-ray emission of these objects, is presented in the Appendix.
The objects studied in this work.
Baumgartner et al. (2011) also provide light curves in eight energy bands: 14–20, 20–24, 24–35, 35–50, 50–75, 75–100, 100–150, and 150–195 keV. These light curves are available from HEASARC1. They were extracted from the individual snapshot images of each ~5 min observation, and the reported count rates were corrected for off-axis effects. We added the count rate of the second, third and fourth band light curves to produce a combined light curve in the 20–50 keV energy band (the “soft” band light curve hereafter; the error in the final count rate was calculated using the usual error propagation rules, i.e. Bevington 1969). In a similar way, we produced 50–100 keV (“hard” band, hereafter) and “full” band (i.e. 20–100 keV) light curves, by adding all the individual light curves in the respective energy ranges.
The resulting light curves were then re-binned to 2 days and 20 days (in the case of NGC 4151, we used a bin size of 1 day, as this is the brightest source in our sample). We produced these light curves by estimating the weighted mean (and its error) of all the points within each bin, provided that there were at least 20 points contributing to the estimation of the mean in it. The average “count rate over error” ratio (which is representative of the average “signal-to-noise ratio” of the light curve) of the hard-band light curves is ~4 for NGC 4151 and ~2−2.5 for the other objects. The ratio increases to ~7 and ~4 for the soft-band light curves of NGC 4151 and the other objects, respectively. Given these values, the 2-day binned light curves at hand can reveal variations that have an amplitude of at least ~25% (50%) the mean flux of the sources in the soft (hard) band.
The same average ratio increases to 15 and ~5–7 for the 20-day binned hard-band light curve of NGC 4151 and the other objects, respectively, and it is even higher (8−27) for the 20-day binned, soft-band light curves. Given these values, the expected average S/N for the hardness ratios is ~11 for NGC 4151 and higher than ~4.5 for all the other objects. These values imply that, even for the lowest S/N light curves, we are able to detect spectral variations that have an amplitude of at least ~20% the mean hardness ratio.
3. Flux variability
The soft, hard and total band light curves are plotted in Fig. 1. They cover ~5 years of almost continuous observations of the objects, and as we argued in the previous section, their length, sampling pattern and relatively high S/N make them ideal for the study of the hard X-ray flux and spectral variations of the sources. A visual inspection of the light curves indicates that all objects display significant variations. The source IC 4329 experiences a gradual flux decay by a factor of ~2 in the first two years of the Swift monitoring (most pronounced in the total band light curve), and then its mean source flux level remains roughly constant with time. Other sources display larger amplitude variations on shorter time scales. For example, variations by a factor of ~5, in less than year, can be easily seen in the light curves of NGC 4151 and NGC 4388.
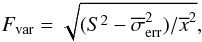
To quantify any significant variations in the light curves we performed a simple χ2 test when fitting the data with a constant. The results are listed in the last column of Table 1, together with the number of the degrees of freedom (d.o.f.). The reduced χ2 values imply that there are highly significant variations. The smallest  value is 1.34 in the case of the hard-band light curve of IC 4329, and, even in this case, the probability of the flux being constant is less than 4 × 10⁻⁴. To quantify the average variability amplitude of the sources, we computed the fractional root mean square variability amplitude, Fvar, of the light curves. Following Vaughan et al. (2003), this quantity is defined as:
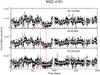 |
Fig. 1 Swift/BAT light curves in the 50–100 keV (bottom panel), 20–50 keV (middle panel), and full band (top panel) for the sources we studied. Solid circles and open squares indicate the 2 d (1 d in the case of NGC 4151), and the 20 d-rebinned light curves, respectively. The time axis counts days since the start of the Swift/BAT observations. The dashed vertical lines in the NGC 4151 plot indicate the case of a flux variation whose evolution in the hard band is faster than the respective flux change in the soft band (see Sect. 3.1 for details). |
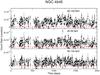 |
Fig. 1 continued. |
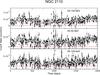 |
Fig. 1 continued. |
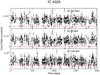 |
Fig. 1 continued. |
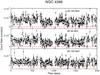 |
Fig. 1 continued. |
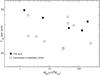 |
Fig. 2 20–50 keV and 2–10 keV fractional variability amplitudes (black solid squares, this work, and open squares, from Sobolewska & Papadakis 2009, respectively) plotted as a function of BH mass. |
 where S2 and
  are the observed variance and mean of the light curve, and
  is the mean square error in all the measurement errors, σerr,i, of each light curve point, i.e. (
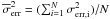 . Since the mean square error, , is representative of the contribution of the measurement errors to the observed variance, S2, Fvar should be an estimate of the intrinsic source variability amplitude over the time period sampled by the Swift/BAT light curves, i.e. ~5 years.
The results are listed in the 3rd column of Table 1. On average, the amplitude of the observed variations ranges from ~30% up to ~55% of the mean count rate. The average amplitude of all objects is comparable in both bands. This is unsurprising, because the plots in Fig. 1 show that the same amplitude variations appear in the soft and hard-band light curves of all objects. Figure 2 shows a plot of the soft band Fvar values versus BH mass for the objects in our sample (black, solid squares). The first thing that we notice is that there appears to be an anti-correlation between the variability amplitude and the BH mass: objects of lower BH mass appear to be “more” variable. The linear correlation coefficient is –0.83, but owing to the small number of objects, the probability of an intrinsic correlation between Fvar and BH mass is just 0.08. The same anti-correlation between variability amplitude and BH mass has also been observed using both long-term (e.g. Papadakis 2004) and short-term X-ray light curves (e.g. O’Neill et al. 2005; Zhou et al. 2010) in the 2–10 keV band.
The average variability amplitude of the AGN we studied is comparable to the average variability amplitude of the AGN long-term 2–10 keV light curves. For example, Sobolewska & Papadakis (2009) studied the flux and variability properties of ten X-ray bright and radio-quiet AGN, using year-long 2–10 keV RXTE light curves. The open squares in Fig. 2 indicate their measurements. At a given BH mass, the variability amplitude of the soft-band Swift light curves is at least as large as that of the 2–10 keV light curves, despite the duration of the Sobolewska & Papadakis (2009) RXTE light curves being longer than ~7 years, i.e. longer than the Swift/BAT light curves we used to prepare this paper.
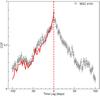 |
Fig. 3 The NGC 4151 cross-correlation between the soft and hard-band light curves (open squares). The solid line (at lags < 0) indicates the CCF values at positive lags (see text for details). |
3.1. Cross-correlation analysis
We calculated the cross correlation function, CCF(k), of the soft and hard band light curves following traditional methods (see e.g. Brinkmann et al. 2003). The CCF was computed at lags of k = 0, ± 1, ± 2, ± 3,..., days in the case of NGC 4151, while the lag bin size was equal to 2 days in the other objects. In all objects, the CCF peaks at zero lag with a maximum value that ranges from ~0.5 to ~0.7. At larger lag values, the CCF decays to zero, with a similar rate in both the positive and negative lags.
Given the excellent S/N of the NGC 4151 light curves, the resulting CCF of this object is much better defined over a large range of time lags. The NGC 4151 CCF is plotted in Fig. 3 (significant CCF peaks at positive lags in this plot means that the soft band variations are leading those in the hard band).
The CCF peaks at a high value of ~0.8 at zero lag. The solid line at negative lags indicates the CCF(k > 0) values (i.e. it is a “mirror line” of the CCF function at positive lags). A comparison of this line with the CCF values at negative lags suggests an asymmetry towards negative lags in the sense that the CCF(k < − 10 days) values are larger than the CCF(k > 10 days) values. If real, this would suggest that, on time scales longer than ~10 days, the hard band lead the soft band variations. However, it is difficult to assess the significance of this result.
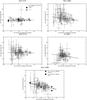 |
Fig. 4 Hardness ratio (50–100 keV)/(20–50 keV) values, estimated using the 20 d-binned light curves, plotted as a function of the total (20–100) keV normalized count rate. The solid lines show the best-fitting linear function to the data. |
We note however that there is at least one “clear” case where the hard band variations do appear to “lead” the variations in the soft band: the vertical dashed line in the middle and bottom panels of the NGC 4151 plot in Fig. 1 indicates the start of a flux drop “event” that appears simultaneously in both bands. However, although the hard band flux reaches its minimum flux level within ~40−60 days, the soft-band flux continues to decrease for at least 60–80 days longer. This more rapid flux decline in the hard band is an example of a hard band “lead”, which can explain the slight asymmetry towards negative lags we observe.
The models.
3.2. Hardness ratio analysis
We used the 20 day-rebinned soft and hard-band BAT light curves (CR20−50 keV and CR50−100 keV, respectively) to compute the hardness ratio, HR = CR50−100 keV/CR20−50 keV, and study the spectral variability of the sources. We assumed that: a) a model fits the data well if the null hypothesis probability is higher than 1%, and b) a model significantly improves the goodness of fit if the null hypothesis probability (i.e. “both models fit the data equally well”) is less than 1%.
First, we fitted the HR-time curves with a constant (hereafter “model A”). This constant is basically equal to the mean HR value,  . The resulting best-fit and χ2 values, together with the number of degrees of freedom (d.o.f.), are listed in the second and third columns of Table 2. These values indicate that the probability of a constant HR is less than 1% in all objects, except for NGC 2110 where the null hypothesis probability is 10.1%.
We then produced “colour-flux” diagrams, i.e. diagrams of the HR values plotted as a function of the total band flux (CR20−100 keV). These diagrams are shown in Fig. 4 (the full-band count rates in these plots are normalized to the respective mean count rate). The NGC 4151 colour-flux diagram shows that the HR values cluster around ~0.4. The high χ2 value when we fit a constant to the NGC 4151 diagram is attributed to only a few points, with small error bars, that scatter randomly around the mean HR. Although these points may indicate significant, intrinsic spectral variations that last for a short period of time (i.e. less than 20 days), the overall picture that emerges from the NGC 4151 diagram in Fig. 4 is that, despite the significant, large amplitude flux variations we observe in this object, the shape of the spectrum should remain roughly constant in this source. This agrees with the results of Lubiński et al. (2010).
On the other hand, the NGC 4388 colour-flux diagram (and perhaps the diagrams of NGC 4945 and IC 4329 as well) indicates that there are flux-related spectral variations: as the source flux increases, the HR values appear to decrease. This is identical to what is observed in the X-ray bright, radio-quite Seyfert galaxies in the 2–10 keV band: the spectrum becomes “softer” with increasing source flux. To quantify the significance of this apparent trend, we fitted all colour-flux diagrams with a linear function of the form HR = α + β × CR20 − 100 keV (hereafter “model B”; during the fit we took into account the errors in both variables, following Press et al. 1994).The best-fit model B results are listed in the last columns of Table 2, and the solid lines in Fig. 4 indicate the best-fit model lines.
In the case of NGC 2110, model B appears to improve the goodness of fit to the HR-flux data of this source (Δχ2 = 9 for 1 d.o.f.; null hypothesis probability = 0.5%). However, as we mentioned above, a constant HR model also provides an acceptable fit to the colour-flux diagram of this source. In addition, the best-fit model B slope is consistent with zero within the errors. We therefore conclude that, as for NGC 4151, we do not find significant evidence of spectral slope variations in NGC 2110.
In contrast to this, the best-fit model slope of NGC 4388 differs of zero (for the case of constant HR) at the 3.3σ level. According to the F-test, model B also provides a significantly better fit to the data (Δχ2 = 38 for 1 d.o.f.; null hypothesis probability = 2.3 × 10⁻⁴%) than model A. We therefore conclude that NGC 4388 undergoes significant spectral variations, with a “softer when brighter” behaviour.
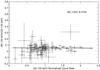 |
Fig. 5 Colour-flux diagram of AX J1631.9-4752. |
The best-fit model B slope for both NGC 4945 and IC 4329 is negative, and consistent with the best-fit slope of NGC 4388 (within the errors). However, the negative slope in these objects is significant at only the 2.2σ and 1.8σ level. On the other hand, model B provides a relatively close fit of the colour-flux diagrams of these sources (null hypothesis probability = 1.1% and 1.4%, respectively), while model A does not. In addition, the improvement of the model B best-fit, when compared to model A best fit, is highly significant in the case of NGC 4945 (Δχ2 = 64 for 1 d.o.f.; null hypothesis probability = 1 × 10⁻⁷%). This is not the case for IC 4329. The colour-flux diagram of this source is broadly similar to the diagrams of NGC 4945 and NGC 4388, but there are quite a few points that cluster around a value of HR ~ 0.2, irrespective of their flux. We conclude that there are indications of flux-related spectral variations in NGC 4945 (mainly) and IC 4329, but that they are not as significant as in NGC 4388.
In summary, NGC 4151 and NGC 2110 do not show significant spectral variations, while we detect significant spectral variability in NGC 4388. The situation is less clear in NGC 4945 and IC 4329: their colour-flux diagrams are similar to NGC 4388, but the presence of spectral variations is not highly significant.
Since NGC 4388 is the lowest flux object in our sample, we investigated the possibility that the spectral variations we detect in this object may be due to unaccounted for systematic uncertainties in its Swift/BAT light curves. For this purpose, we downloaded from HEASARC the Swift/BAT light curves of AX J1631.9-4752, a source with a 20–100 keV flux similar to the flux of NGC 4388. This is an X-ray pulsar in a high mass X-ray binary. Its spectrum is closely fitted with an exponentially cut-off power-law model and a cut-off energy of ~10 keV. It remains constant (in shape) during both flaring and non-flaring periods (Rodriguez et al. 2006). Figure 5 shows the colour-flux diagram for this source. A few HR values in this diagram are negative, because the source’s flux is very low above 50 keV, due to the fact that its X-ray spectrum is very steep above 20 keV. For the same reason, the HR values are on average smaller than the HR values of NGC 4388 and the other objects in our sample. The points along the x-axis indicate significant flux variations, whose amplitude is even larger than the amplitude of the X-ray variations we observe in NGC 4388.
Despite these large amplitude variations, the colour-flux diagram of this source appears to be remarkably flat. The solid line in the same figure indicate the best-fit model B line to the data. The best-fit slope is –0.0023 ± 0.007, which is entirely consistent with the value of zero. We therefore conclude that the flux-related spectral variations we detect in NGC 4388 are most probably intrinsic to the source, and were not caused by any systematic uncertainties. If the error in the best-fit model B slope were less than 0.01 for an object with no intrinsic spectral variations, and a count rate similar to (or less than) the count rate of the sources in our sample (such as AX J1631.9-4752), then the best-fit model B slopes for the NGC 4945 and IC 4329 colour-flux diagrams should also be indicative of significant spectral variations in these sources.
4. Spectral variability
4.1. Interpretation of the “colour-flux” diagrams
Although the hardness ratios can be used to detect spectral variations in a model-independent way, they cannot distinguish, unambiguously, the model components that are responsible for the observed variations. The main reason is that in most cases (including our work) the hardness ratios are computed using light curves over energy bands that are quite broad, and as a result multiple components contribute to the observed count rate. To investigate in a quantitative way the constraints that the colour-flux diagrams in Fig. 4 can impose on current theoretical models, we performed the “experiment” we describe below.
Thermal Comptonization is the most commonly accepted mechanism for the X-ray emission from radio-quiet AGN. We therefore considered a “Comptonization plus reflection” model, similar to that used numerous times in the past to fit the high energy X-ray spectra of many AGN, and we computed the expected hardness ratios when the model parameters were allowed to vary. We produced “theoretical” colour-flux diagrams, which we then compared with the observed diagrams.
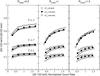 |
Fig. 6 Plot of model colour-flux diagrams in the case of a “thermal Comptonization plus a reflection component constant in flux” model. Different values for the (mean) reflection covering factor, power-law photon index and the temperature of the electrons in the corona have been considered, namely Rmean = 0.3,1,1.5, from left to right, Γ = 1.3,1.7,2.1, from top to bottom (in each panel), and kTe = 50,100,200 keV, indicated with open squares, solid, and open circles, respectively. |
We first used the thermally comptonized continuum model Nthcomp in XSPEC (Zdziarski et al. 1996; Zycki et al. 1999). The main model parameters were the spectral slope, Γ, and the electron temperature, kTe, which determines the high energy rollover of the spectrum. As for the other model parameters, we assumed a seed photon temperature of 10 eV, and a “disk blackbody” input spectrum. None of these two parameters affect significantly the shape of the spectrum at energies > 20 keV. We then added a reflection component using the pexrav code (Magdziarz & Zdziarski. 1995), available in XSPEC, which calculates the reflected exponentially cutoff power-law spectrum from neutral material. In all cases, we assumed an inclination angle of 45o, Γpexrav = ΓNthcomp, and Ec,pexrav = kTe,Nthcomp. The reflection amplitude, R, was negative so that pexrav would output the reflection component only. We also considered neutral absorption with NH = 1023 cm-2 (similar to values measured in the past for the objects we studied – see Appendix), although this assumption did not affect significantly the spectrum at the energies we considered.
We downloaded the diagonal BAT survey instrument response from HEASARC2, and we used XSPEC to simulate Swift/BAT spectra for Γ = 1.3,1.7,2.1. For each Γ, we considered three different electron temperatures: kTe = 50,100,200 keV. For each pair of (Γ,kTe) values, we used five different normalization values of Nthcomp, from A = 1 to A = 9 photon cm-2 s-1, in steps of ΔA = 2 photon cm-2 s-1, to produce five simulated spectra (our results do not depend on the particular choice of the model normalization, as long as the ratio (Amax/Amin) is large enough to reproduce the observed maximum-to-minimum flux variations). Finally, we added to the model a constant flux reflection component3. The flux of the reflection component was such that Rmean = 0.3,1, and 1.5 in the case of the Nthcomp “mean” spectrum (i.e. the continuum when Amean = 5 photon cm-2 s-1). In this scenario, R should obviously decrease with increasing flux, since the flux of the reflection component remains constant.
For each model spectrum, we computed the (20–100), (20–50) and (50–100) keV count rates, and the respective hardness ratio (50–100 keV count rate)/(20–50 keV count rate). As a result, we were able to produce the model colour-flux diagrams, which we plot in Fig. 6. The x-axis in these plots indicate the 20–100 keV model count rate normalized to the same band count rate of the “mean” spectrum. The spread in the values along the x-axis is similar to that of the model and the observed colour-flux diagrams (Fig. 4).
The results for the Rmean = 0.3,1, and 1.5 case are plotted in the left, middle and right panels in this figure, respectively. Within each panel, the top, middle and bottom curves indicate the model colour-flux diagrams for Γ = 1.3,1.7 and 2.1, respectively. Even the mean HR value of a source can provide information about its Rmean and Γ. For example, the expected HR value should be ~0.2 if Rmean = 1.5 and Γ ~ 2.1, as opposed to ~ 0.55−0.7 in the case of Rmean = 0.3 and Γ ~ 1.3. This is of course the case for the most widely separated parameter values we considered, and the difference between the model colour-flux diagrams becomes less pronounced for smaller differences in the input physical parameters. Nevertheless, a comparison between the observed and model colour-flux diagrams plotted in Figs. 4 and 6 can provide interesting results.
For example, that HRNGC 4151, NGC 2110 ~ 0.4 implies that Γ < 1.7 and Rmean < 1 in both sources. If Γ were steeper than 1.7, then HR should be smaller than 0.4, while if Rmean ≥ 1, then we should have observed a significantly positive correlation between HR and flux (see the diagrams in Fig. 6 for Γ > 1.7 and Rmean ≥ 1), which is not the case.
Open squares and both filled and open circles in each group of curves plotted in all panels of Fig. 6 correspond to kTe = 50,100 and 200 keV, respectively. The model HRs clearly do not depend significantly on kTe. At a given flux, HR decreases with decreasing kTe, as the 50 − 100 keV band flux decreases accordingly. These variations become more pronounced for Γ > 1.7 and Rmean > 1 (see the two bottom group of curves in the middle and right panel of Fig. 5). In this case, when kTe changes from 200 keV to 50 keV, HR decreases by ~0.1, which is comparable to the HR variation that occurs when Γ steepens from 1.7 to 2.1 (for the same kTe).
In any case, the general trend of all the model diagrams in Fig. 6 is that of a positive correlation between HR and flux. Since the reflection component has a constant flux, and is more pronounced at energies below 50 keV, the soft-band count rate should remain roughly constant at low flux states; since the hard band flux continues to decrease with decreasing flux, HR decreases accordingly. Nevertheless we found for both NGC 4151 and NGC 2110 that HR remains constant, despite the significant flux variability of the sources.
The filled squares and triangles in the NGC 4151 colour-flux panel (Fig. 4) indicate the model colour-flux diagrams when Γ = 1.6 and 1.7, respectively, Rmean = 0.3, and kTe decreases from 200 keV, in the lowest flux, to 50 keV for the highest flux spectrum. The agreement between the observed and the model colour-flux diagrams is quite good. In the case of NGC 4151, any model diagram with a constant kTe will have a positive slope larger than the slope of the dashed and solid lines shown in this panel, and will obviously provide a worse “fit” to the data. In other words, a kTe variation with flux is required in this source to reproduce its observed flat colour-flux diagram. In the presence of a constant flux reprocessed component, a power-law component which simply varies with flux does not result in a flat colour-flux diagram. The kTe variation between 50 − 200 keV that our analysis implies is in excellent agreement with the results reported by Lubiński et al. (2010) for the same source. A similar physical picture could also apply to with the observed colour-flux diagram of NGC 2110.
A positive correlation is the opposite of the one we observed in NGC 4388 (and NGC 4945 and IC 4329 as well). Within the context of the model we considered, we could reproduce an HR-flux anti-correlation only if the intrinsic Γ correlates positively with flux. Filled circles, connected with a solid line, in the observed colour-flux diagram of NGC 4388 in Fig. 4 indicate the model HR values when Rmean = 0.3, kTe = 100 keV, and Γ increases from 1.3, in the lowest flux, to 2.1, for the highest flux model spectrum. Although the model colour-flux diagram slope is steeper than the observed best-fit slope (a result that implies that the intrinsic ΔΓ in NGC 4388 is probably smaller than the ΔΓmodel = 0.8 we considered), it is obvious that the observed spectral variations in NGC 4388 (and to a lesser extent also in NGC 4945 and IC 4329) can be explained by an intrinsic spectral slope steepening with increasing flux.
5. Discussion and conclusions
We have used the 58-month-long Swift/BAT monitoring light curves to study the flux and spectral variability of the five brightest Seyfert galaxies in the catalogue of Baumgartner et al. (2011). Our main results are summarized below.
-
Both the 20–50 and 50–100 keV band light curves, of all five objects, were significantly variable on time scales as short as 1–2 days. Their average variability amplitude was of the order of ~30−50% of the mean source flux. We also found evidence that the variability amplitude is inversely proportional to the BH mass of the objects, a trend that has also been observed in AGN, but at energies below 10 keV.
Since the column of the neutral material that obscures the X-ray source in these objects is less than 1024 cm-2, it cannot significantly affect the X-ray emission of the sources above 20 keV. Consequently, the Swift/BAT light curves can reveal the “true” variability behaviour of the central source in these, without the complications associated with the effects of the absorbing material at energies below ~10 keV. Therefore, the observed variability must be intrinsic to the central source. Furthermore, the similarity of the variability amplitudes at energies above 20 keV and below 10 keV in AGN (for a given BH mass) implies that the main driver of the observed flux variations below ~20 keV on time scales longer than 1–2 days might also be the intrinsic normalisation variations in the source continuum.
-
The soft (20–50 keV) and hard band (50–100 keV) light curves, in all objects, were well-correlated. We did not detect any delays down to 1 day, which is the smallest time scale we can sample with the light curves we used. In other words, similar variations appear, almost simultaneously, in both energy bands.
In the case of NGC 4151, which is the object with the highest S/N light curves, we detected a soft band delay, on time scales longer than ~10 days. This is the first time that such a delay within the X-ray band has been observed in an AGN, but it was not easy to quantify the significance of this result, and it was unclear what its implications are. If real, such a result implies that a physical mechanism (perhaps a change in the temperature of the hot plasma in the corona?) affected first the high energy part of the spectrum of the source, and then propagated to softer energies.
-
Our hardness ratio analysis suggested that, despite the significant flux variations, the shape of the 20–100 keV spectrum remains constant in NGC 4151 and NGC 2110. On the other hand, we detected significant spectral variations in NGC 4388: the hardness ratios were found to decrease as the flux increases. A similar trend was also observed in NGC 4945 and IC 4329, but its significance is marginal.
There is as yet no clear understanding of the physical parameters that drive the spectral evolution of AGN. As reported in the Appendix, previous studies of the sources in our sample identified hard X-ray spectral variations produced by changes in either the photon index of the X-ray continuum, the reflection amplitude, and/or the temperature of the Comptonizing electrons.
The use of the (20–50) and (50–100) keV band light curves to compute the HRs means that we have not been very sensitive to the detection of kTe variations, as long as kTe > 50 keV. Interestingly though, the flatness of the colour-flux diagrams of NGC 4151 and NGC 2110 suggests that the electron temperature should decrease with increasing flux in these objects. This agrees with the results of Lubiński et al. (2010) in the case of NGC 4151. Furthermore, the average HR value in these objects suggest that Rmean should be less than unity, and Γintrinsic less than ~1.7.
Our comparison of the colour-flux diagrams of NGC 4388 (and perhaps of NGC 4945 and IC 4329 as well) with the predictions of thermal Comptonization models has provided support for the view that the main driver of spectral variability in this source is intrinsic spectral slope variations: Γintrinsic correlates positively with the source flux, while the reflection component flux remains constant. As a result, Robs should also decrease with increasing flux.
It is difficult to identify the physical parameter responsible for the Γintrinsic-flux correlation that we observe in NGC 4388. An anti-correlation between kTe and source flux, similar to the one observed in NGC 4151, might be responsible, if the optical depth of the corona remains constant: in this case, a decrease in the temperature of the corona would result in a steeper continuum. On the other hand, the same NGC 4151 observations have suggested that, as kTe varies, the optical depth of the corona also varies so that the Compton parameter y (and hence Γ as well) remains constant (for this source). Therefore, flux-related optical depth variations could also explain the Γ − flux correlation, if kTe remained constant. However, since previous studies have measured kTe variations in NGC 4388 (see Appendix), we believe that variations in the coronal temperature are the main driver of the spectral variability in this object.
A “softer when brighter” behaviour is commonly detected in Seyferts at energies below 10 keV, on both short and long time scales. Sobolewska & Papadakis (2009) found that the observed spectral variations of X-ray bright AGN in the 2–20 keV band can be explained if  . If this were the case, the maximum-to-minimum flux ratio of ~7 for NGC 4388 would imply a Γmax/Γmin ratio of ~1.2. The dashed line in the bottom panel of Fig. 4 indicates the expected colour-flux diagram when Γ = 1.3, for the lowest flux, and Γ = 1.7 for the highest flux spectrum (so that Γmax/Γmin ~ 1.3). The model colour-flux diagram has a larger amplitude than the amplitude of the observed diagram, most probably because Rmean > 0.3 in this source. However, the slope of both the model and the observed colour-flux diagram are quite similar. Therefore, our results, agree with and support those of Sobolewska & Papadakis (2009).
The absence of significant spectral variations in NGC 4151 and NGC 2110, although rare among Seyferts at lower energies, is not unique. For example, Sobolewska & Papadakis (2009) found that “NGC 5548 displayed limited spectral variations for its flux variability”, and Papadakis et al. (2003) observed the same behaviour in PG 0804+761. One important difference between NGC 4151 and NGC 2110 and the other three sources in the sample is that they accrete at ~1% (or less) of the Eddington limit (see Appendix), as opposed to ~10% (or higher) for the other sources. Sobolewska et al. (2011) studied the long-term “spectral slope-flux” evolution of two well-studied GBHs, namely GRO J1655-40 and GX 339-4. Their results indicate that at accretion rates ~0.01 (or smaller) of the Eddington limit, the X-ray spectral slope is ~1.3−1.6, and it remains roughly constant over a large flux range (see the middle panel of their Fig. 2; in particular the panel with the GRO J1655-40 data). This is also exactly the case for NGC 4151 and NGC 2110, which both have an accretion rate lower than ~1%, a spectral slope flatter than ~1.7 (see e.g. Lubiński et al. 2010; Winter et al. 2009) and do not exhibit significant spectral variations. These similarities suggest that there are different “spectral states” in AGN, as in GBHs, with NGC 4151 and NGC 2110 being “hard-state” systems.
This choice corresponds to the case of reflection from a distant, neutral reflector, i.e. the putative molecular torus. If the torus is a few pc away from the central source, the resulting reflection spectrum should be constant on time scales of a few years.
Acknowledgments
This research has made use of data obtained from the High Energy Astrophysics Science Archive Research Center (HEASARC), provided by NASA’s Goddard Space Flight Center. M.C.G., I.E.P. and F.N. acknowledge support by the EU FP7-REGPOT 206469 grant.
References
- Barthelmy, S. D., Barbier, L. M., Cummings, J. R., et al. 2005, SSRv, 120, 143 [Google Scholar]
- Baumgartner, W. H., Tueller, J., Markwardt, C., et al. 2011, ApJS, submitted [Google Scholar]
- Beckmann, V., Gehrels, N., Favre, P., et al. 2004, ApJ, 614, 641 [NASA ADS] [CrossRef] [Google Scholar]
- Beckmann, V., Shrader, C. R., Gehrels, N., et al. 2005, ApJ, 634, 939 [NASA ADS] [CrossRef] [Google Scholar]
- Beckmann, V., Barthelmy, S. D., Courvoisier, T. J.-L., et al. 2007, A&A, 475, 827 [NASA ADS] [CrossRef] [EDP Sciences] [Google Scholar]
- Beckmann, V., Soldi, S., Ricci, C., et al. 2009, A&A, 505, 417 [NASA ADS] [CrossRef] [EDP Sciences] [Google Scholar]
- Bentz, M. C., Denney, K. D., Cackett, E. M., et al. 2006, ApJ, 651, 775 [NASA ADS] [CrossRef] [Google Scholar]
- Bevington, P. R. 1969, Data reduction and error analysis for the physical Sciences (New York: McGraw-Hill) [Google Scholar]
- Boella, G., Butler, R. C., Perola, G. C., et al. 1997, A&AS, 122, 299 [NASA ADS] [CrossRef] [EDP Sciences] [Google Scholar]
- Brinkmann, W., Papadakis, I. E., den Herder, J. W. A., et al. 2003, A&A, 402, 929 [NASA ADS] [CrossRef] [EDP Sciences] [Google Scholar]
- Butler, R. C., & Scarsi, L. 1991, AdSpR, 11, 265 [NASA ADS] [Google Scholar]
- Crenshaw, D. M., & Kraemer, S. B. 2007, ApJ, 659, 250 [NASA ADS] [CrossRef] [Google Scholar]
- de Rosa, A., Piro, L., Perola, G. C., et al. 2007, A&A, 463, 903 [NASA ADS] [CrossRef] [EDP Sciences] [Google Scholar]
- Done, C., Madejski, G. M., & Smith, D. A. 1996, ApJ, 463, L63 [NASA ADS] [CrossRef] [Google Scholar]
- Done, C., Madejski, G. M., & Życki, P. T. 2000, ApJ, 536, 213 [NASA ADS] [CrossRef] [Google Scholar]
- Done, C., Madejski, G. M., Życki, P. T., et al. 2003, ApJ, 588, 763 [NASA ADS] [CrossRef] [Google Scholar]
- Elvis, M., Risaliti, G., Nicastro, F., et al. 2004, ApJ, 615, L25 [NASA ADS] [CrossRef] [Google Scholar]
- Evans, D. A., Lee, J. C., Turner, T. J., et al. 2007, ApJ, 671, 1345 [NASA ADS] [CrossRef] [Google Scholar]
- Filippenko, A. V., & Sargent, W. L. W. 1985, ApJS, 57, 503 [NASA ADS] [CrossRef] [Google Scholar]
- Gehrels, N., Chincarini, G., Giommi, P., et al. 2004, ApJ, 611, 1005 [NASA ADS] [CrossRef] [Google Scholar]
- George, I. M., & Fabian, A. C. 1991, MNRAS, 249, 352 [NASA ADS] [CrossRef] [Google Scholar]
- Ghisellini, G., Haardt, F., & Matt, G. 1994, MNRAS, 267 743 [Google Scholar]
- Greenhill, L. J., Moran, J. M., & Herrnstein, J. R. 1997, ApJ, 481, L23 [NASA ADS] [CrossRef] [Google Scholar]
- Guainazzi, M., Matt, G., Brandt, W. N., et al. 2000, A&A, 356, 463 [NASA ADS] [Google Scholar]
- Haardt, F., Maraschi, L., & Ghisellini, G. 1997, ApJ, 476, 620 [NASA ADS] [CrossRef] [Google Scholar]
- Itoh, T., Done, C., Makishima, K., et al. 2008, PASJ, 60S, 251 [NASA ADS] [Google Scholar]
- Iwasawa, K., Koyama, K., Awaki, H., et al. 1993, ApJ, 409, 155 [NASA ADS] [CrossRef] [Google Scholar]
- Johnson, W. N., Grove, J. E., Kinzer, R. L., et al. 1993, A&AS, 183, 6403 [Google Scholar]
- Lubiński, P., Zdziarski, A. A., Walter, R., et al. 2010, MNRAS, 408, 1851 [NASA ADS] [CrossRef] [Google Scholar]
- Madejski, G. M., Zdziarski, A. A., Turner, T. J., et al. 1995, ApJ, 438, 672 [NASA ADS] [CrossRef] [Google Scholar]
- Madejski, G., Życki, P., Done, C., et al. 2000, ApJ, 535L, 87 [Google Scholar]
- Magdziarz, P., & Zdziarski, A. A. 1995, MNRAS, 273, 837 [NASA ADS] [CrossRef] [Google Scholar]
- Malaguti, G., Bassani, L., Cappi, M., et al. 1999, A&A, 342, L41 [NASA ADS] [Google Scholar]
- Markowitz, A. 2009, ApJ, 698, 1740 [NASA ADS] [CrossRef] [Google Scholar]
- Mauersberger, R., Henkel, C., Whiteoak, J. B., et al. 1996, A&A, 309, 705 [NASA ADS] [Google Scholar]
- Miyoshi, S., Yamashita, K., Okumura, Y., et al. 1988, PASJ, 40, 127 [NASA ADS] [Google Scholar]
- Nandra, K., Le, T., George, I. M., et al. 2000, ApJ, 544, 734 [NASA ADS] [CrossRef] [Google Scholar]
- O’Neill, P. M., Nandra, K., Papadakis, I. E., & Turner, T. J. 2005, MNRAS, 358, 1405 [NASA ADS] [CrossRef] [Google Scholar]
- Papadakis, I. E. 2004, MNRAS, 348, 207 [NASA ADS] [CrossRef] [Google Scholar]
- Paul, J., Ballet, J., & Cantin, M. 1991, AdSpR, 11, 289 [Google Scholar]
- Perola, G. C., Matt, G., Cappi, M., et al. 1999, A&A, 351, 937 [NASA ADS] [Google Scholar]
- Petrucci, P. O., Haardt, F., Maraschi, L., et al. 2000, ApJ, 540, 131 [NASA ADS] [CrossRef] [Google Scholar]
- Petrucci, P. O., Haardt, F., Maraschi, L., et al. 2001, ApJ, 556, 716 [NASA ADS] [CrossRef] [Google Scholar]
- Phillips, M. M., & Malin, D. F. 1982, MNRAS, 199, 905 [NASA ADS] [CrossRef] [Google Scholar]
- Piro, L., Nicastro, F., Feroci, M., et al. 1999, NuPhS, 69, 481 [Google Scholar]
- Piro, L., de Rosa, A., Dadina, M., et al. 2000, AdSpR, 25, 453 [Google Scholar]
- Press, W. H., Teukolski, S. A., Vetterling, W. T., & Flannery, B. P. 1994, The Art of Scientific Computing (Cambridge: Cambridge University Press) [Google Scholar]
- Risaliti, G., Elvis, M., Fabbiano, G., Baldi, A., & Zezas, A. 2005, ApJ, 623, L93 [NASA ADS] [CrossRef] [Google Scholar]
- Risaliti, G., Elvis, M., Fabbiano, G., Baldi, A., Zezas, A., & Salvati, M. 2007, ApJ, 659, L111 [NASA ADS] [CrossRef] [Google Scholar]
- Risaliti, G., Salvati, M., Elvis, M., et al. 2009, MNRAS, 393L, 1 [Google Scholar]
- Rodriguez, J., Bodaghee, A., Kaaret, P., et al. 2006, MNRAS, 366, 274 [NASA ADS] [CrossRef] [Google Scholar]
- Shirai, H., Fukazawa, Y., Sasada, M., et al. 2008, PASJ, 60S, 263 [NASA ADS] [CrossRef] [Google Scholar]
- Sobolewska, M. A., & Papadakis, I. E. 2009, MNRAS, 399, 1597 [NASA ADS] [CrossRef] [Google Scholar]
- Sobolewska, M. A., Siemiginowska, A., & Gierliński, M. 2011, MNRAS, 413, 2259 [NASA ADS] [CrossRef] [Google Scholar]
- Soldi, S., Ponti, G., Beckmann, V., et al. 2010 [arXiv:1001.4348] [Google Scholar]
- Turner, T. J., & Miller, L. 2009, A&ARv, 17, 47 [Google Scholar]
- Wilson, A. S., & Penston, M. V. 1979, ApJ, 232, 389 [NASA ADS] [CrossRef] [Google Scholar]
- Winter, L. M., Mushotzky, R. F., Reynolds, C. S., et al. 2009, ApJ, 690, 1322 [NASA ADS] [CrossRef] [Google Scholar]
- Woo, J.-H., & Urry, C. M. 2002, ApJ, 579, 530 [NASA ADS] [CrossRef] [Google Scholar]
- Zdziarski, A. A., Johnson, W. N., & Magdziarz, P. 1996, MNRAS, 283, 193 [NASA ADS] [CrossRef] [Google Scholar]
- Zhou, X. L., Zhang, S. N., Wang, D. X., & Zhu, L. 2010, ApJ, 710, 16 [NASA ADS] [CrossRef] [Google Scholar]
- Zycki, P. T., Done, C., & Smith, D. A. 1999, MNRAS 309, 561 [Google Scholar]
Appendix A
We present the results of previous studies of the hard X-ray spectrum of the sources in the sample.
A.1. NGC 4151
NGC 4151 is a nearby Seyfert 1.5 galaxy, and the brightest persistent AGN in the 20–100 keV energy band (after the radio-loud blazar Cen A). It hosts a BH with a mass of  , as estimated from reverberation mapping studies (Bentz et al. 2006) and radiates at a rate of LBol/LEDD = 0.014 (Crenshaw & Kraemer 2007).
Its spectrum has been extensively studied from radio wavelengths to hard X-rays. Its energy spectrum above 20 keV is well-fitted by a power-law model (PL, hereafter), with an exponential cut-off above energies 50–200 keV (see e.g. Piro et al. 1999 and 2000; Beckmann et al. 2005 and 2009; Lubiński et al. 2010). Lubiński et al. (2010) in particular, suggested that the cut-off energy, Ec, anti-correlates with the source flux, increasing from ~5−80 keV, at high fluxes, to ~100−200 keV, when the source is in a “dim flux state”. The spectral slope of the PL component, Γ, is rather hard (compared to other, X-ray bright, Seyfert galaxies) with best-fit values of ~1.4−1.6 (see e.g. Zdziarski et al. 1996; Petrucci et al. 2001; Winter et al. 2009). de Rosa et al. (2007) suggested that there may be flux-related, intrinsic spectral slope variations in this source. In addition to the PL component, Ginga observations first established a “reflection hump” at energies above 10 keV (Zdziarski et al. 1996). This component has been detected by all major hard X-ray satellites since then, but with a variable amplitude, R, that ranged between 0.01 and almost 1 (i.e. the value expected in the case of a point source located on top of the accretion disc at a relatively great height). Finally, it is well-established that the X-ray spectrum of NGC 4151 is also affected by the neutral material, perhaps with a variable covering factor, and a column density, NH, less than ~1023 cm-2 (see e.g. Lubiński et al. 2010, and references therein).
A.2. NGC 4945
NGC 4945 is a nearby (3.7 Mpc; Mauersberger et al. 1996) Seyfert 2 galaxy, with a BH mass estimate of ≈ 1.4 × 10⁶ M⊙ (Greenhill et al. 1997), which radiates at a rate of LBol/LEDD = 0.10 − 0.60 (Madejski et al. 2000). Ginga observations detected a hard X-ray source in this galaxy, which is heavily absorbed at energies below 10 keV by neutral material with an NH as high as ~1024 cm-2 (Iwasawa et al. 1993). Large amplitude X-ray variations at energies above 10 keV, on time scales shorter than ≤ 1 − 2 days (and as short as ~104 s) have been detected by RXTE, BeppoSAX and Suzaku observations (Madejski et al. 2000; Guainazzi et al. 2000; Itoh et al. 2008). These flux variations did not appear to be correlated with spectral variability (Guainazzi et al. 2000). Best-fit Γ values range between 1.4 and 1.8 (see e.g. Iwasawa et al. 1993; Done et al. 1996; Madejski et al. 2000; Guainazzi et al. 2000; Beckmann et al. 2009; Winter et al. 2009). In addition, the high energy cut-off in the X-ray spectrum was constrained to be in the range ~100−300 keV, while the reflection component appeared to have a rather small value of R ~ 0.06 (Done et al. 2003).
A.3. NGC 2110
NGC 2110 is a nearby (z = 0.007579) Seyfert 2 galaxy. It hosts a black hole with a mass of 2 × 10⁸ M⊙ (Woo & Urry 2002) and radiates at LBol/LEDD = 10-3−10-2 (Evans et al. 2007). BeppoSAX observations (Malaguti et al. 1999) revealed a steep power-law spectrum of Γ = 1.9, and the presence of a neutral absorber with NH ≈ 7 × 1023 cm-2, partially covering the source. The same observations implied a rather low value for the reflection covering factor (R ≤ 0.17 or ≤ 0.5, if Ec = 1000 or 50 keV, respectively). An analysis of the Second INTEGRAL Catalogue (Beckmann et al. 2009) measured best-fit values of Γ = 2 and NH = 4.3 × 1022 cm-2 for the PL slope and the column density of the absorbing neutral material that is intrinsic to the source. Spectral studies of the Swift/BAT spectra (Winter et al. 2009) provided estimates of the photon index and column density of the neutral absorber of  and
and  .
.
A.4. IC 4329
IC 4329 is a relatively nearby (z = 0.0157; Wilson & Penston 1979), X-ray luminous AGN. It hosts a black hole with a mass of  and radiates at a ratio of
  (Markowitz 2009). BeppoSAX observations have shown significant variations in the 0.1–100 keV flux emission from the source (Perola et al. 1999), which were not associated with significant spectral variations. Its Compton/OSSE observations have identified a high energy cut-off in the hard X-ray spectrum of the source, at energies 250 keV ≤ Ec ≤ 1700 keV (Madejski et al. 1995). Subsequent INTEGRAL observations found a smaller cut-off energy of ~80 keV (Beckmann et al. 2009). The best-fit X-ray spectral slope values at hard energies range from ~1.4 to ~1.8 (see e.g. Beckman et al. 2009; Winter et al. 2009). There are indications of neutral absorption intrinsic to the source, with an NH < 1024 cm-2, and of the presence of a reflection hump with a strength of R ~ 0.4−1.2 (see e.g. Miyoshi et al. 1998; Done & Madejski 2000).
A.5. NGC 4388
NGC 4388 is a nearby (z = 0.00842) almost edge-on (i ≃ 78°) spiral galaxy hosting a Seyfert 2 nucleus (Phillips & Malin 1982; Filippenko & Sargent 1985). It hosts a black hole with a mass of 6 × 10⁶ M⊙ (Woo & Urry 2002) and radiates at LBol/LEDD = 0.1 (Elvis et al. 2004). The SIGMA (Paul et al. 1991), OSSE (Johnson et al. 1993) and BeppoSAX (Butler et al. 1991; Boella et al. 1991) observations acquired for this galaxy over 13 years showed no spectral shape variations of the PL. Subsequent INTEGRAL (Beckmann et al. 2004) and Suzaku (Shirai et al. 2008) observations revealed that the flux increased by a factor of 1.4 and 1.5, respectively (with a month to half-day times cales, respectively). The best-fit X-ray spectral slope values at hard energies range from ≈ 1.3 to ≈ 1.8 (Beckmann et al. 2009; Winter et al. 2009), with column density of NH = 2 − 3 × 1023 cm-2. The hard X-ray spectrum does not show a strong cut-off in the X-rays at E ≤ 100 keV, with the most likely estimate being  keV, from INTEGRAL observations (Beckmann et al. 2009). The reflection component was detected during the Suzaku observations and the reflection covering factors was constrained to be R = 1.3 − 1.5. There is barely any spectral shape variation between the high and the low-flux states, with the most important change being the normalization of the underlying power-law continuum from the nucleus.
All Tables
All Figures
|
Fig. 1 Swift/BAT light curves in the 50–100 keV (bottom panel), 20–50 keV (middle panel), and full band (top panel) for the sources we studied. Solid circles and open squares indicate the 2 d (1 d in the case of NGC 4151), and the 20 d-rebinned light curves, respectively. The time axis counts days since the start of the Swift/BAT observations. The dashed vertical lines in the NGC 4151 plot indicate the case of a flux variation whose evolution in the hard band is faster than the respective flux change in the soft band (see Sect. 3.1 for details). |
| In the text | |
|
Fig. 1 continued. |
| In the text | |
|
Fig. 1 continued. |
| In the text | |
|
Fig. 1 continued. |
| In the text | |
|
Fig. 1 continued. |
| In the text | |
|
Fig. 2 20–50 keV and 2–10 keV fractional variability amplitudes (black solid squares, this work, and open squares, from Sobolewska & Papadakis 2009, respectively) plotted as a function of BH mass. |
| In the text | |
|
Fig. 3 The NGC 4151 cross-correlation between the soft and hard-band light curves (open squares). The solid line (at lags < 0) indicates the CCF values at positive lags (see text for details). |
| In the text | |
|
Fig. 4 Hardness ratio (50–100 keV)/(20–50 keV) values, estimated using the 20 d-binned light curves, plotted as a function of the total (20–100) keV normalized count rate. The solid lines show the best-fitting linear function to the data. |
| In the text | |
|
Fig. 5 Colour-flux diagram of AX J1631.9-4752. |
| In the text | |
|
Fig. 6 Plot of model colour-flux diagrams in the case of a “thermal Comptonization plus a reflection component constant in flux” model. Different values for the (mean) reflection covering factor, power-law photon index and the temperature of the electrons in the corona have been considered, namely Rmean = 0.3,1,1.5, from left to right, Γ = 1.3,1.7,2.1, from top to bottom (in each panel), and kTe = 50,100,200 keV, indicated with open squares, solid, and open circles, respectively. |
| In the text | |
Current usage metrics show cumulative count of Article Views (full-text article views including HTML views, PDF and ePub downloads, according to the available data) and Abstracts Views on Vision4Press platform.
Data correspond to usage on the plateform after 2015. The current usage metrics is available 48-96 hours after online publication and is updated daily on week days.
Initial download of the metrics may take a while.