Fig. 1
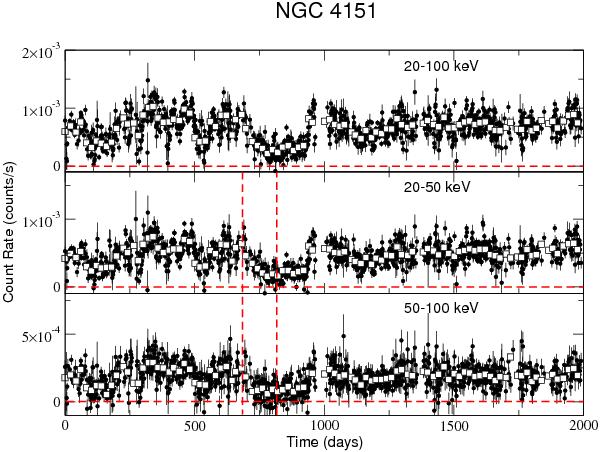
Swift/BAT light curves in the 50–100 keV (bottom panel), 20–50 keV (middle panel), and full band (top panel) for the sources we studied. Solid circles and open squares indicate the 2 d (1 d in the case of NGC 4151), and the 20 d-rebinned light curves, respectively. The time axis counts days since the start of the Swift/BAT observations. The dashed vertical lines in the NGC 4151 plot indicate the case of a flux variation whose evolution in the hard band is faster than the respective flux change in the soft band (see Sect. 3.1 for details).
Current usage metrics show cumulative count of Article Views (full-text article views including HTML views, PDF and ePub downloads, according to the available data) and Abstracts Views on Vision4Press platform.
Data correspond to usage on the plateform after 2015. The current usage metrics is available 48-96 hours after online publication and is updated daily on week days.
Initial download of the metrics may take a while.