| Issue |
A&A
Volume 537, January 2012
|
|
|---|---|---|
| Article Number | A144 | |
| Number of page(s) | 21 | |
| Section | Interstellar and circumstellar matter | |
| DOI | https://doi.org/10.1051/0004-6361/201117524 | |
| Published online | 24 January 2012 | |
Herschel/HIFI observations of O-rich AGB stars: molecular inventory⋆,⋆⋆
1 Onsala Space Observatory, Dept. Earth and Space Science, Chalmers University of Technology, 439 92 Onsala, Sweden
e-mail: This email address is being protected from spambots. You need JavaScript enabled to view it.
2 Sterrenkundig Instituut Anton Pannekoek, University of Amsterdam, Science Park 904, 1098 Amsterdam, The Netherlands
3 University of Bonn, Argelander-Institut für Astronomie, Auf dem Hügel 71, 53121 Bonn, Germany
4 Observatorio Astronómico Nacional (IGN), Alfonso XII N°3, 28014 Madrid, Spain
5 Instituut voor Sterrenkunde, Katholieke Universiteit Leuven, Celestijnenlaan 200D, 3001 Leuven, Belgium
6 Observatorio Astronómico Nacional, Ap 112, 28803 Alcalá de Henares, Spain
7 European Space Astronomy Centre, ESA, PO Box 78, 28691 Villanueva de la Cañada, Madrid, Spain
8 CAB, INTA-CSIC, Ctra de Torrejón a Ajalvir, km 4, 28850 Torrejón de Ardoz, Madrid, Spain
9 Department of Astrophysics/IMAPP, Radboud University Nijmegen, Nijmegen, The Netherlands
10 Astronomical Institute, Utrecht University, Princetonplein 5, 3584 CC Utrecht, The Netherlands
11 Harvard-Smithsonian Center for Astrophysics, Cambridge, MA 02138, USA
12 Max-Planck-Institut für Radioastronomie, Auf dem Hügel 69, 53121 Bonn, Germany
13 Johns Hopkins University, Baltimore, MD 21218, USA
14 Joint ALMA Observatory, Alonso de Córdova 3107, Vitacura, Santiago, Chile
15 N. Copernicus Astronomical Center, Rabiańska 8, 87-100 Toruń, Poland
16 European Southern Observatory, Karl Schwarzschild Str. 2, Garching bei München, Germany
Received: 20 June 2011
Accepted: 14 November 2011
Abstract
Aims. Spectra, taken with the heterodyne instrument, HIFI, aboard the Herschel Space Observatory, of O-rich asymptotic giant branch (AGB) stars which form part of the guaranteed time key program HIFISTARS are presented. The aim of this program is to study the dynamical structure, mass-loss driving mechanism, and chemistry of the outflows from AGB stars as a function of chemical composition and initial mass.
Methods. We used the HIFI instrument to observe nine AGB stars, mainly in the H2O and high rotational CO lines. We investigate the correlation between line luminosity, line ratio and mass-loss rate, line width and excitation energy.
Results. A total of nine different molecules, along with some of their isotopologues have been identified, covering a wide range of excitation temperature. Maser emission is detected in both the ortho- and para-H2O molecules. The line luminosities of ground state lines of ortho- and para-H2O, the high-J CO and NH3 lines show a clear correlation with mass-loss rate. The line ratios of H2O and NH3 relative to CO J = 6−5 correlate with the mass-loss rate while ratios of higher CO lines to the 6−5 is independent of it. In most cases, the expansion velocity derived from the observed line width of highly excited transitions formed relatively close to the stellar photosphere is lower than that of lower excitation transitions, formed farther out, pointing to an accelerated outflow. In some objects, the vibrationally excited H2O and SiO which probe the acceleration zone suggests the wind reaches its terminal velocity already in the innermost part of the envelope, i.e., the acceleration is rapid. Interestingly, for R Dor we find indications of a deceleration of the outflow in the region where the material has already escaped from the star.
Key words: stars: AGB and post-AGB / circumstellar matter / stars: late-type / infrared: stars / line: identification
Herschel is an ESA space observatory with science instruments provided by European-led Principal Investigator consortia and with important participation from NASA.
Appendix A is available in electronic form at http://www.aanda.org
Deceased.
© ESO, 2012
1. Introduction
Asymptotic giant branch (AGB) stars represent a late stage of stellar evolution when the nuclear burning in the core has ceased. The dominant factor governing the rest of their evolution is the mass loss from the surface (Habing 1996). Presently, the initial mechanism(s) driving the wind which leads to dust formation in O-rich stars is not fully understood. Model calculations of dynamics of the photosphere of AGB stars show that shockwaves arising from pulsation can levitate the material and produce an extended atmosphere (e.g., Bowen 1988; Hoefner & Dorfi 1992, 1997). The latter authors showed that the models lead to dust formation in the atmosphere. Although the efficiency of dust formation in the outflow of AGB stars has been questioned (see e.g., Woitke 2006), Höfner (2008) proposed the wind is driven by micron-size grains which are Fe-poor. Mattsson et al. (2008) also show that for AGB stars with a low metallicity, pulsation can lead to an intense mass-loss rate. Due to the larger cross sections of dust grains compared to molecules, dust efficiently absorbs stellar radiation and is accelerated outwards, dragging the gas along with it (Goldreich & Scoville 1976; Justtanont et al. 1994; Decin et al. 2006; Ramstedt et al. 2008). This effectively establishes a circumstellar envelope around the star.
The circumstellar envelope of an AGB star is an active site for chemistry. The slowly expanding wind (ve ~ 10−15 km s-1) produced by a constant, isotropic mass-loss rate, is an ideal laboratory to study physical and chemical processes during stellar evolution. In thermal equilibrium, the relative abundance of carbon and oxygen determines the composition of the molecules and dust species formed. For a carbon-rich star with C/O > 1, carbonaceous molecules form as well as amorphous carbon and SiC dust after all the oxygen is locked up in the most abundant trace molecule CO. In contrast, for a star with C/O < 1, i.e., O-rich (M-type) AGB stars, H2O and CO are the main gas components, along with silicate dust. However, close to the photosphere, shock waves due to stellar pulsations and/or the stellar radiation field can induce non-thermal equilibrium, rendering this simple picture more complicated (Cherchneff 2006). As an example, the canonical C-rich AGB star, IRC+10216 has been found to exhibit H2O emission (Melnick et al. 2001; Hasegawa et al. 2006; Decin et al. 2010a). Data obtained with Herschel-HIFI have recently shown that H2O is quite prevalent in C-stars (Neufeld et al. 2011).
HIFISTARS is the guaranteed time key program aimed at studying circumstellar envelopes around evolved stars using the heterodyne instrument (HIFI, de Graauw et al. 2010) aboard the Herschel Space Observatory (Pilbratt et al. 2010). The program aims to study stars with a large range of mass-loss rates (10-7−10-4 M⊙ yr-1), differing chemistry (C/O < 1, C/O ~ 1, C/O > 1) and initial mass (low- and intermediate mass stars and supergiants), as well as different evolutionary (AGB to planetary nebula) phases. In this paper, we report all the observations done on O-rich AGB stars in our program. Observations and data reduction are presented in Sect. 2 and the lines detected and the first-cut interpretation are discussed in Sect. 3. The results are summarised in Sect. 4.
2. Observations
Our HIFI observations were carried out using dual-beam switch mode with a throw of 3′ and a slow chopping. The full bandwidth of HIFI of 4 GHz was utilized using the wide-beam-spectrometer backend. A total of 16 different frequency settings have been chosen to cover a number of expected strong lines of H2O and CO for the purpose of sampling different regions of the warm circumstellar envelope in these objects. The data were calibrated using the standard Herschel pipeline, HIPE, and reprocessed for those which had been processed with the pipeline version earlier than 4.0. Data were taken using two orthogonal polarizations: horizontal and vertical. A resulting spectrum is an average of these two polarizations which is then rebinned to a 1 km s-1 resolution (Figs. A.1−A.12). However, a number of spectra in the THz-band (HIFI bands 6 and 7) were affected by the ripples, especially in the v-polarization. These are thought to be due to standing waves in the hot electron bolometer (HEB) mixers. In these cases, we rebinned only the h-polarization spectrum. The spectra have been corrected for the beam efficiency, ηmb
 (1)where σ is the surface accuracy (=3.8 μm), λ is the wavelength of the transition and ηmb,0 is a correction factor of 0.76, except for the frequency range of 1120 − 1280 GHz (HIFI band 5) where this value is 0.66 (Olberg 2010, http://herschel.esac.esa.int/Docs/TechnicalNotes/HIFI-Beam-Efficiencies-17Nov2010.pdf).
O-rich AGB stars in the sample.
In three objects, IRC+10011, IK Tau, and W Hya, we observe a large number of frequency settings (15, 15 and 16, respectively), with the intention of using them as templates for other objects with high, intermediate and low mass-loss rates, respectively. In order to study a larger sample of stars, we also observed 6 further objects with fewer frequency settings selected from the original settings (Table 1) which include many diagnostic lines (see Table A.1).
In order to estimate the integrated line intensity, a Gaussian fit was performed in IDL. Some lines are flat-topped and hence the line intensity was estimated using a rectangular (rhombic) profile. Due to the observing mode used, it is not possible to recover the true continuum level of the spectra. However, the estimated line intensities are not affected by this since we subtract the continuum prior to calculating them. Our error estimates reflect only the noise in the baseline. Other uncertainties such as the assumption that a line is Gaussian are not included. However, independent measurements of the line intensity by summing the area under the line agree within twice the estimated uncertainties listed in Table A.1. The absolute flux calibration error is expected to be ~30% in the HIFI bands 6 and 7 and less (~15%) at lower frequencies.
3. Molecular lines
We identify a total of 9 different molecular species as well as associated isotopologues (Table A.1). Most of the lines are in the ground vibrational state. However, for H2O and SiO, vibrationally excited lines are also seen indicating that the lines originate from the hotter part of the envelope (Sect. 3.3). Many of the settings observed in the star IK Tau have been presented by Decin et al. (2010b) and are included here for completeness of our sample, along with new observations.
It has been postulated that H2O is one of the main molecular coolants in the circumstellar envelopes of O-rich AGB stars, along with CO (Goldreich & Scoville 1976). This was confirmed by observations by the Infrared Space Observatory (ISO) of these stars which show numerous strong lines of both these molecules (e.g. Barlow et al. 1996; Neufeld et al. 1996). We detected a total of 23 H2O lines in all the three main isotopologues covering the excitation temperature from 30 to 2350 K. These lines probe the full extent of the circumstellar envelope and due to HIFI resolution, the lines are well resolved, enabling us to study the dynamics of the dust-driven wind. It should be noted that the H2O 11,0 − 10,1 vibrationally excited line at 658.0 GHz is likely to be a maser, as well as the 620.7 GHz (53,2 − 44,1) line (see Sect. 3.2). This latter line has previously been reported in the supergiant VY CMa (Harwit et al. 2010). As for CO, we detected a total of 8 transitions in three isotopologues.
Other molecules are also identified, such as NH3, SiO, HCN, SO, SO2 and OH. These molecules have already been detected in HIFI spectra of AGB and post-AGB stars (Bujarrabal et al. 2010; Decin et al. 2010b; Menten et al. 2010; Justtanont et al. 2010; Schöier et al. 2011). In AFGL 5379, a line is detected at 1196.010 GHz which can be attributed to the H2S (3,1,2) − (2,2,1) transition. This line is not seen in the other stars in our sample, however it is present in the supergiant VY CMa (Alcolea 2011, in prep.). A line is also seen in the spectrum of OH 26.5+0.6 at 1114.431 GHz which corresponds to the vibrationally excited SiS J = 62−61 transition. Although, with the high upper energy level of 1918.3836 cm-1, we classify this line as unlikely.
Since HIFI employs a double-side band mode, there is a possibility of ambiguity in classifying a line. The line at 1112.833 GHz in the lower side-band due to 29SiO J = 26−25 coincides with the H2O 116,6 − 123,9 at 1101.130 GHz. Considering the upper energy levels and the expected line strengths of the two, we conclude that the line is likely due to 29SiO.
3.1. Line intensities
All objects show strong emission due to H2O and CO molecules (Fig. 1). The OH/IR stars, OH 26.5+0.6, AFGL 5379 and IRC+10011, show very strong emission of both ground state ortho- and para-H2O lines compared to that of CO J = 6−5. Despite the high mass-loss rates in these OH/IR stars, the CO J = 16−15 is very weak or not detected. This may be partly due to the attenuation of stellar light by dust, preventing the excitation of this line. In o Cet, the CO lines are much stronger than other molecular species. This is likely due to the white-dwarf companion with its hard X-ray flux (O’Dwyer et al. 2003) photodissociating H2O molecules in the circumstellar envelope of the primary star. In all the stars, we detect both 12CO and 13CO. The line ratios of the corresponding transitions vary from 1.5 in stars with high mass-loss rate to up to 10 in stars with lower mass-loss rates.
We detected both the ortho- and para-H2O as well as the isotopologues and vibrationally excited lines. A discussion on isotopic ratios of detected lines is presented by Silva et al. (2011, in prep.). A detailed modelling of radiative transfer of stars with low mass-loss rates is in progress (Maercker et al. 2011, in prep.). The highest excitation lines seen in our spectra are the vibrationally excited 212 − 101 and the vibrationally excited ground state lines of both ortho- and para-H2O with excitation energies in excess of 2000 K (Table A.1). These lines are likely radiatively pumped.
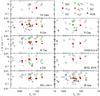 |
Fig. 1 Integrated line intensities for all stars in the sample. 12CO: black open circles; 13CO red filled circles; H |


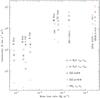 |
Fig. 2 A plot of the line luminosity (squares: ortho-H2O 11,0 − 10,1, circles: para-H2O 11,1 − 00,0, stars: CO J = 6−5, × : CO J = 10−9, triangles: NH3 10 − 00) as a function of the published mass-loss rate show a strong correlation between the two parameters. |
In Fig. 2, we plot the line luminosity as a function of mass-loss rate for CO J = 6 − 5, 10 − 9, and the ground-state lines of both ortho- and para-H2O, as well as for NH3 10 − 00. The distances and mass-loss rates are taken from de Beck et al. (2010); Maercker et al. (2009); Justtanont et al. (2006) (see Table 1). There is a strong positive correlation between individual H2O and CO line luminosities, i.e., the slopes for the mass-loss rate up to ~10-5 M⊙ yr-1 are betwen 0.7 − 0.8. There is one exception regarding the H2O luminosity in o Cet which is much lower than for the CO. This is likely due to H2O being photodissociated by the binary companion. The flattening off of this relation at Ṁ ~ 3 × 10⁻⁵ M⊙ yr-1 is consistent with relations by de Beck et al. (2010).
Another molecule readily detected in circumstellar envelopes of AGB stars is SiO (e.g., Bujarrabal et al. 1994; Olofsson et al. 1998). Here, we identified three silicon isotopes. The vibrationally excited lines of high-J transitions are also seen.
SO has been observed in a number of AGB stars covering a wide range in mass-loss rates. The estimated abundance is a few 10-7 up to 10-6 M⊙ yr-1 (Omont et al. 1993; Bujarrabal et al. 1994). However, we only observed SO and SO2 lines in our HIFI frequency range in stars with low mass-loss rates. From ISO observations, SO2 absorption is detected towards stars with optically thin envelopes (Yamamura et al. 1999), while this is not seen in optically thick shells. SO is thought to be formed mainly via S + CO and to a lesser extent via S + OH (Cherchneff 2006) and is expected to be present throughout the envelope. It follows then that the formation of SO2 is via SO + OH. The best example for SO and SO2 can be seen in our spectrum of R Dor (Fig. A.6). In this object, the line fluxes of the SO lines are about an order of magnitude larger than that of SO2. In the other stars where both molecules are observed, the flux ratios are less than 5. The only other S-bearing molecule seen in our spectra is H2S in AFGL 5379 at 1196.0 GHz. This line is absent in all the other stars in our sample, compare to a more ubiquitous presence of this molecule observed from the ground in OH/IR stars (Omont et al. 1993).
We detected the OH triplet line at 1834.7 GHz, which is very strong in the two extreme OH/IR stars, in agreement with the fact that these stars emit strongly in the OH 1612 MHz maser (e.g., Sevenster et al. 2001). The spectrum of IRC+10011 is contaminated by ripples (standing waves in the HEB mixers) preventing us from confirming the presence of the OH line.
To study the effects of mass-loss rate on the excitation, we plot line intensity ratios of CO J = 16−15 and J = 10−9 relative to the J = 6−5 (Fig. 3 middle panel). These ratios appear to be constant over four orders of magnitude of mass-loss rates, indicating that the density is higher than critical density of these transitions, i.e., the lines are thermalized in the emitting region. The line ratios of the ground state lines of both ortho- and para-H2O with CO, on the other hand, show an increasing trend as a function of mass-loss rate with the para-H2O having a consistently higher ratio than that of the ortho-H2O. This same increasing trend can be seen between the NH3 10 − 00 and mass-loss rates, indicative of similar excitation conditions for both molecules. The top panel of Fig. 3 shows the SO/CO and SO2/CO ratios. Here, a decreasing trend for the line ratio with the mass-loss rate can be seen. From the HIFI observations, both SO and SO2 are not detected in stars with a mass-loss rate higher than 10-5 M⊙ yr-1. It is therefore not possible to confirm the tight correlation seen by Olofsson et al. (1998) between CO (J = 1−0) and SO (Jk = 32 − 21) line fluxes. Omont et al. (1993), however, detected low excitation lines of SO and SO2 (Tex ≤ 55 K) in 14 OH/IR stars, including three stars in our sample (IRC+10011, IK Tau and OH 26.5+0.6). In optically thick envelopes, the high excitation levels of the sulphur-bearing molecules in the HIFI range (Tex ≥ 200 K) are simply not sufficiently excited.
3.2. H2O masers
 |
Fig. 3 A plot of the line ratios relative to the integrated intensity of the CO J = 6 − 5 as a function of mass-loss rates. In the lower panel: for ortho-H2O 11,0 − 10,1 (squares), para-H2O 11,1 − 00,0 (circles), NH3 10 − 00 (triangles) scaled up by a factor of 5. The middle panel shows CO J = 10−9 ( × ), CO J = 16 − 15 (stars) and in the upper panel: SO (1313 − 1212) 559.3 and SO (1314 − 1213) 560.2 GHz (triangles) and SO2 (216,16 − 215,17) 558.4 and SO2 (371,37 − 360,36) 659.4 GHz (squares). |
Maser emission has been observed toward a large number of evolved stars. Its signature includes an anomalously strong line intensity and a narrow line width due to maser amplification. In some instances, a maser can be seen in a narrow peak in the blue wing.
In three objects (W Hya, IK Tau, and IRC+10011), we observe the 620.7 GHz transition of ortho-H2O 53,2−44,1 which is predicted to be masing (Neufeld & Melnick 1991). The maser line is brighter compared to the thermal excited lines and tends to have a narrower line profile as the region of coherent velocity required to produce maser emission is generally small. In W Hya, the maser line is narrow compared to the thermally excited lines of H2O 11,0−10,1 and CO J = 6 − 5, indicating it comes from a region close to the star. In IK Tau, the line exhibits a double-peak profile which has a line width slightly narrower than that of the 556.9 GHz ground-state ortho-H2O and the CO line. In IRC+10011, however, the line is of the same width as the ground state H2O and CO J = 6−5 lines, and is thought to arise from thermal emission, but it also has a strong blue component due to the masing action (see Fig. 4 lower panels). This is in line with the expectation that the 620.7 GHz line is masing at high (~103 K) temperature (Neufeld & Melnick 1991). The maser emission appears to arise from the blue-shifted part of the spectrum, i.e., in the front side of the envelope. Neufeld & Melnick (1991) also predicted a maser line at 970.3 GHz from para-H2O (52,4 − 43,1) which we observed in W Hya and IK Tau with similar line widths and profiles as for the 620.7 GHz maser. In IRC+10011, we did not detect a maser peak (Fig. 4 upper panels), and the line is about the same brightness as for the ground transition line at 556.9 GHz (Table A.1), hence the maser action appears to be quenched in this object.
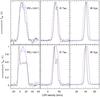 |
Fig. 4 The lower panels show a comparison of the normalized line profile of the 620.7 GHz H2O 53,2 − 44,1 line (solid line) with the ground state ortho-H2O 11,0 − 10,1 line at 556.9 GHz (dotted red line) and the CO J = 6−5 (dashed blue line). The upper panels show the 970.3 GHz H2O 52,4 − 43,1 (solid) with same the H2O ground state and CO lines. |
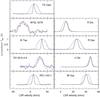 |
Fig. 5 A comparison of the normalized line profile of the 658.0 GHz H2O line (solid line) with the ground state ortho-H2O line at 556.9 GHz (dotted red line) and the CO J = 6−5 (dashed blue line). |
In one of the frequency settings, we detected the vibrationally excited H2O 11,0−10,1 line at 658.0 GHz which is likely masing (Fig. 5). In all the objects with low and intermediate mass-loss rates, the maser line is markedly narrow compared to the 556.9 GHz line except for o Cet, where both lines have comparable widths. This indicates, again, that the maser line in the majority of the stars originates close to the star where the wind has not yet reached the terminal velocity. The intrinsic line intensity supports the fact that the line is masing, i.e., the line intensity of the vibrationally excited line is very bright, compared with the ground state line at 556.9 GHz. However, in extreme OH/IR stars (OH 26.5+0.6 and AFGL 5379), the widths of the ground and vibrationally excited lines are comparable and the flux of the vibrationally excited line is small relative to the ground state line. It is unlikely then in these two objects that the line is masing. This is probably due to the high density quenching maser action in the inner part of the envelope.
We also observe the vibrationally excited line of para-H2O 11,1 − 00,0 at 1205.8 GHz. Unlike the vibrationally excited 11,0 − 10,1 ortho-H2O, this line does not appear to be masing when comparing with the same transition in the ground vibrational state at 1113.3 GHz as the vibrationally excited line is much weaker.
3.3. Expansion velocity of circumstellar envelops
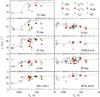 |
Fig. 6 Observed expansion velocity for molecular lines in our sample stars. |
Once dust grains condense in the outflow of AGB stars, the wind acceleration mechanism is thought to be due to radiation pressure on the dust grains, which drags the gas as they move away from the central star (e.g., Goldreich & Scoville 1976; Habing et al. 1994). Lines with a high excitation temperature are expected to be emitted in regions close to the star, where the wind has not yet reached its terminal velocity. Consequently, these lines would be observed to be narrower than lines with lower excitation temperatures, emitted from farther out in the envelope. Justtanont et al. (1994) demonstrated that in a radiative transfer calculation for successively higher-J CO lines, the warmer regions of the emitting zone are being probed which have smaller line widths than for the lowest CO transition. However, observations of maser lines which probe regions close to the central star revealed that the wind acceleration is not as fast as predicted by the dust-drag wind (Chapman et al. 1994). In Fig. 6, we plot the expansion velocities for the lines detected in our spectra, which probe the warm region as well as the region close to the central star. Here, the observed expansion velocity is a measure of half the width at the baseline level. The uncertainty of the expansion velocity is ~15−30%. In most cases, there is a trend that lower excitation lines have wider observed line profiles, indicating they come from regions where the wind is close to the previously determined expansion velocity from ground-based observations of low-J CO lines. This indicates that there is a velocity gradient in the circumstellar outflow. One caveat is that for H2O lines, the profile can be heavily absorbed in the blue wing, leading to slightly lower measured expansion velocities. This can be seen in Fig. 6 which shows that the measured expansion velocity of CO J = 6 − 5 is larger than that for the ground state of both ortho- and para-H2O. We observe isotopic lines of H2O, and a trend can be seen that  O). This may be due to the fact that the less abundant species are more prone to photodissociation from the interstellar radiation hence we see molecules close to the central star where the gas has not yet reached the terminal velocity.
For all stars, 3 CO lines have been targeted: J = 6−5, 10−9 and 16−15. The widths of these lines show the trend of increasing velocity for the lower excitation line, in agreement with the acceleration. However, the J = 16−15 line is not seen towards the two extreme OH/IR stars, OH 26.5+0.6 and AFGL 5379, possibly due to the dust attenuation of stellar radiation, preventing the excitation of this line. We readily detected the 13CO lines in our frequency settings as well and in most cases, the line widths of these two isotopes are comparable.
The line widths of SO and SO2 are narrower than those from CO and H2O. Due to the low abundance, the lines are not thought to be optically thick, hence the reason why the lines are narrower is likely because they originate from the inner region of the envelope. It can be that these molecules are also destroyed closer in the central star by interstellar UV radiation, compared to the more robust CO molecules. In some stars with a relatively low mass-loss rate, the measured velocities of SiO J = 16−15 and 29SiO J = 13−12 lines also are smaller than those from CO.
A number of stars show a clear trend of the high excitation lines having a smaller line width than low excitation ones (Fig. 6), consistent with a region where the molecules are then accelerated towards the terminal velocity observed in the ground-based low-J CO observations. In order to qualitatively show that the wind is accelerated, we overplot a function similar to the dust-driven wind of Lamers & Cassinelli (1999) but with a dependence on the energy rather than the radius: ![Mathematical equation: \begin{equation} v = v_{0} + (v_{\rm e} - v_{0}) [1. - E_{0}/E]^\beta \end{equation}](/articles/aa/full_html/2012/01/aa17524-11/aa17524-11-eq65.png) (2)where v0,ve and E0 are arbitrary initial and expansion velocities in km s-1 and energy in K, respectively, and β is a velocity exponent (Table 2). The parameters are chosen to follow the 12CO transitions as a the main tracer for the expansion velocity. In a few cases, however, no clear jump in velocity between high and low excitation lines is seen, and a straight line can better describe the velocity field (right panels in Fig. 6). The fitted lines are least-square-fits to all the data points. In general, despite the smaller observed expansion velocity of SO, SO2, SiO and less abundant isotopologues of H2O and CO, the measured velocities of these species follow the overall trend of increasing velocity with decreasing excitation energy, i.e., increasing radius from the central star.
(2)where v0,ve and E0 are arbitrary initial and expansion velocities in km s-1 and energy in K, respectively, and β is a velocity exponent (Table 2). The parameters are chosen to follow the 12CO transitions as a the main tracer for the expansion velocity. In a few cases, however, no clear jump in velocity between high and low excitation lines is seen, and a straight line can better describe the velocity field (right panels in Fig. 6). The fitted lines are least-square-fits to all the data points. In general, despite the smaller observed expansion velocity of SO, SO2, SiO and less abundant isotopologues of H2O and CO, the measured velocities of these species follow the overall trend of increasing velocity with decreasing excitation energy, i.e., increasing radius from the central star.
In the case of R Dor, however, the highly excited lines of both H2O and SiO indicate a larger expansion velocity in the inner part of the envelope than for the lower J-transitions of CO. This is counter-intuitive compared to what is expected of an accelerating dust-driven wind and may pose a challenge to detailed radiative transfer modelling of the stellar wind of R Dor. Also in AFGL 5379 and OH 26.5+0.6, the expansion velocity of various lines suggests that the wind reaches the terminal velocity already in the innermost part, i.e., the acceleration zone is very small since the line widths are similar regardless of the excitation. For W Hya, the line widths increase linearly with the decreasing excitation energy. These stars demonstrate that the gas-dust interaction does not seem to follow a simple momentum transfer previously used to describe the wind. To fully understand the observed line widths, a full radiative transfer must be performed including a velocity field and temperature profile.
4. Summary
We present the full dataset on O-rich AGB stars as part of the guaranteed time key program HIFISTARS to study the late stages of stellar evolution both kinematically and dynamically. We detect emission of 9 molecular species and their most common isotopologues. We find a trend of increasing line luminosity of H2O, CO and NH3 with the mass-loss rate (Fig. 2) which tapers off for stars with a high mass-loss rate. Interestingly, the line ratios of high-J CO relative to CO J = 6 − 5 are independent of the mass-loss rate (Fig. 3). This implies that the excitation of high-J CO is independent of the density, i.e., the lines are thermalized. Other species such as H2O and NH3 show a positive correlation with the mass-loss rate.
From the line brightness and shape, we conclude that the H2O 620.7 GHz is masing in all three objects observed. The 970.3 GHz and the 658.0 GHz lines are masing in objects with relatively low ( ≤ 10-5 M⊙ yr-1) mass-loss rates. These maser lines are generally significantly narrower than the thermal H2O lines.
Since the lines are well resolved, we can use the observed line width to derive the expansion velocity for each transition. In general, highly excited lines which originate close to the star have smaller expansion velocities compared to the lower excitation lines (Fig. 6). This is in agreement with the gas being dragged by dust grains as they are accelerated outward due to stellar radiation. However, from our observations, the acceleration zone differs in our sample, with stars with a high mass-loss rate showing high-excitation lines having velocity close to the terminal velocity while stars with a low mass-loss rate having a distinct low velocity region (Eu ≤ 103 K). In R Dor, the highly excited lines show smaller observed line widths than the low excited lines. For this object, the gas appears to be decelerating as it moves away from the central star. A caveat is the optical depth which can affect the line profile. In order to calculate this effect, a full radiative transfer has to be performed in individual objects. This work has started and will be presented in the forth coming papers.
Online material
Appendix A: Spectra
In this section, we present the observed spectra of O-rich AGB stars observed in the HIFISTARS guaranteed time program, along with the measured line intensities.
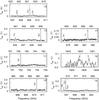 |
Fig. A.2 HIFI spectra of IRC+10011, continued. |
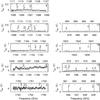 |
Fig. A.3 HIFI spectra of o Cet. |
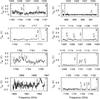 |
Fig. A.4 HIFI spectra of IK Tau. |
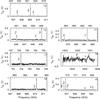 |
Fig. A.5 HIFI spectra of IK Tau, continued. |
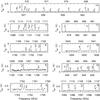 |
Fig. A.6 HIFI spectra of R Dor. |
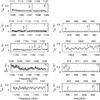 |
Fig. A.7 HIFI spectra of TX Cam. |
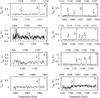 |
Fig. A.8 HIFI spectra of WHya. |
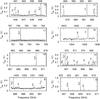 |
Fig. A.9 HIFI spectra of WHya, continued. |
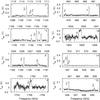 |
Fig. A.10 HIFI spectra of AFGL 5379. |
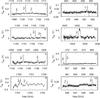 |
Fig. A.11 HIFI spectra of OH 26.5+0.6. |
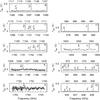 |
Fig. A.12 HIFI spectra of R Cas. |
Calculated line intensities (K km s-1) of the observed lines.
Acknowledgments
HCSS/HSpot/HIPE is a joint development (are joint developments) by the Herschel Science Ground Segment Consortium, consisting of ESA, the NASA Herschel Science Center, and the HIFI, PACS and SPIRE consortia. K.J., F.S., M.M., and H.O. acknowledge funding from the Swedish National Space Board. This work has been partially supported by the Spanish MICINN, within the program CONSOLIDER INGENIO 2010, under grant “Molecular Astrophysics: The Herschel and Alma Era – ASTROMOL” (ref.: CSD2009-00038). R.Sz. and M.Sch. acknowledge support from grant N 203 581040 from Polish MNiSW. J.C. thanks funding from MICINN, grant AYA2009-07304. This research was performed, in part, through a JPL contract funded by the National Aeronautics and Space Administration. We would like to thank the referee for his/her careful reading and suggestions which improved the manuscript.
References
- Barlow, M. J., Nguyen-Q-Rieu, Truong-Bach, et al. 1996, A&A, 315, L241 [NASA ADS] [Google Scholar]
- Bowen, G. H. 1988, ApJ, 329, 299 [NASA ADS] [CrossRef] [Google Scholar]
- Bujarrabal, V., Fuente, A., & Omont, A. 1994, A&A, 285, 247 [NASA ADS] [Google Scholar]
- Bujarrabal, V., Alcolea, J., Soria-Ruiz, R., et al. 2010, A&A, 521, L3 [NASA ADS] [CrossRef] [EDP Sciences] [Google Scholar]
- Chapman, J. M., Sivagnanam, P., Cohen, R. J., & Le Squeren, A. M. 1994, MNRAS, 268, 475 [NASA ADS] [CrossRef] [Google Scholar]
- Cherchneff, I. 2006, A&A, 456, 1001 [NASA ADS] [CrossRef] [EDP Sciences] [Google Scholar]
- de Beck, E., Decin, L., de Koter, A., et al. 2010, A&A, 523, A18 [NASA ADS] [CrossRef] [EDP Sciences] [Google Scholar]
- de Graauw, T., Helmich, F. P., Phillips, T. G., et al. 2010, A&A, 518, L6 [Google Scholar]
- Decin, L., Hony, S., de Koter, A., et al. 2006, A&A, 456, 549 [NASA ADS] [CrossRef] [EDP Sciences] [Google Scholar]
- Decin, L., Agúndez, M., Barlow, M. J., et al. 2010a, Nature, 467, 64 [NASA ADS] [CrossRef] [PubMed] [Google Scholar]
- Decin, L., Justtanont, K., de Beck, E., et al. 2010b, A&A, 521, L4 [CrossRef] [EDP Sciences] [Google Scholar]
- Goldreich, P., & Scoville, N. 1976, ApJ, 205, 144 [Google Scholar]
- Habing, H. J. 1996, A&ARv, 7, 97 [NASA ADS] [CrossRef] [Google Scholar]
- Habing, H. J., Tignon, J., & Tielens, A. G. G. M. 1994, A&A, 286, 523 [NASA ADS] [Google Scholar]
- Harwit, M., Houde, M., Sonnentrucker, P., et al. 2010, A&A, 521, L51 [NASA ADS] [CrossRef] [EDP Sciences] [Google Scholar]
- Hasegawa, T. I., Kwok, S., Koning, N., et al. 2006, ApJ, 637, 791 [NASA ADS] [CrossRef] [Google Scholar]
- Hoefner, S., & Dorfi, E. A. 1992, A&A, 265, 207 [NASA ADS] [Google Scholar]
- Hoefner, S., & Dorfi, E. A. 1997, A&A, 319, 648 [NASA ADS] [Google Scholar]
- Höfner, S. 2008, A&A, 491, L1 [NASA ADS] [CrossRef] [EDP Sciences] [Google Scholar]
- Justtanont, K., Skinner, C. J., & Tielens, A. G. G. M. 1994, ApJ, 435, 852 [NASA ADS] [CrossRef] [Google Scholar]
- Justtanont, K., Olofsson, G., Dijkstra, C., & Meyer, A. W. 2006, A&A, 450, 1051 [NASA ADS] [CrossRef] [EDP Sciences] [Google Scholar]
- Justtanont, K., Decin, L., Schöier, F. L., et al. 2010, A&A, 521, L6 [NASA ADS] [CrossRef] [EDP Sciences] [Google Scholar]
- Lamers, H. J. G. L. M., & Cassinelli, J. P. 1999, Introduction to Stellar Winds (Cambridge, UK: Cambridge University Press) [Google Scholar]
- Maercker, M., Schöier, F. L., Olofsson, H., et al. 2009, A&A, 494, 243 [NASA ADS] [CrossRef] [EDP Sciences] [Google Scholar]
- Mattsson, L., Wahlin, R., Höfner, S., & Eriksson, K. 2008, A&A, 484, L5 [NASA ADS] [CrossRef] [EDP Sciences] [Google Scholar]
- Melnick, G. J., Neufeld, D. A., Ford, K. E. S., Hollenbach, D. J., & Ashby, M. L. N. 2001, Nature, 412, 160 [NASA ADS] [CrossRef] [PubMed] [Google Scholar]
- Menten, K. M., Wyrowski, F., Alcolea, J., et al. 2010, A&A, 521, L7 [NASA ADS] [CrossRef] [EDP Sciences] [Google Scholar]
- Neufeld, D. A., & Melnick, G. J. 1991, ApJ, 368, 215 [NASA ADS] [CrossRef] [Google Scholar]
- Neufeld, D. A., Chen, W., Melnick, G. J., et al. 1996, A&A, 315, L237 [NASA ADS] [Google Scholar]
- Neufeld, D. A., González-Alfonso, E., Melnick, G., et al. 2011, ApJ, 727, L29 [NASA ADS] [CrossRef] [Google Scholar]
- O’Dwyer, I. J., Chu, Y., Gruendl, R. A., Guerrero, M. A., & Webbink, R. F. 2003, AJ, 125, 2239 [NASA ADS] [CrossRef] [Google Scholar]
- Olofsson, H., Lindqvist, M., Nyman, L.-A., & Winnberg, A. 1998, A&A, 329, 1059 [NASA ADS] [Google Scholar]
- Omont, A., Lucas, R., Morris, M., & Guilloteau, S. 1993, A&A, 267, 490 [NASA ADS] [Google Scholar]
- Pilbratt, G. L., Riedinger, J. R., Passvogel, T., et al. 2010, A&A, 518, L1 [CrossRef] [EDP Sciences] [Google Scholar]
- Ramstedt, S., Schöier, F. L., Olofsson, H., & Lundgren, A. A. 2008, A&A, 487, 645 [NASA ADS] [CrossRef] [EDP Sciences] [Google Scholar]
- Schöier, F. L., Maercker, M., Justtanont, K., et al. 2011, A&A, 530, A83 [NASA ADS] [CrossRef] [EDP Sciences] [Google Scholar]
- Sevenster, M. N., van Langevelde, H. J., Moody, R. A., et al. 2001, A&A, 366, 481 [NASA ADS] [CrossRef] [EDP Sciences] [Google Scholar]
- Woitke, P. 2006, A&A, 460, L9 [NASA ADS] [CrossRef] [EDP Sciences] [Google Scholar]
- Yamamura, I., de Jong, T., Onaka, T., Cami, J., & Waters, L. B. F. M. 1999, A&A, 341, L9 [NASA ADS] [Google Scholar]
All Tables
All Figures
|
Fig. 1 Integrated line intensities for all stars in the sample. 12CO: black open circles; 13CO red filled circles; H |
| In the text | |
|
Fig. 2 A plot of the line luminosity (squares: ortho-H2O 11,0 − 10,1, circles: para-H2O 11,1 − 00,0, stars: CO J = 6−5, × : CO J = 10−9, triangles: NH3 10 − 00) as a function of the published mass-loss rate show a strong correlation between the two parameters. |
| In the text | |
|
Fig. 3 A plot of the line ratios relative to the integrated intensity of the CO J = 6 − 5 as a function of mass-loss rates. In the lower panel: for ortho-H2O 11,0 − 10,1 (squares), para-H2O 11,1 − 00,0 (circles), NH3 10 − 00 (triangles) scaled up by a factor of 5. The middle panel shows CO J = 10−9 ( × ), CO J = 16 − 15 (stars) and in the upper panel: SO (1313 − 1212) 559.3 and SO (1314 − 1213) 560.2 GHz (triangles) and SO2 (216,16 − 215,17) 558.4 and SO2 (371,37 − 360,36) 659.4 GHz (squares). |
| In the text | |
|
Fig. 4 The lower panels show a comparison of the normalized line profile of the 620.7 GHz H2O 53,2 − 44,1 line (solid line) with the ground state ortho-H2O 11,0 − 10,1 line at 556.9 GHz (dotted red line) and the CO J = 6−5 (dashed blue line). The upper panels show the 970.3 GHz H2O 52,4 − 43,1 (solid) with same the H2O ground state and CO lines. |
| In the text | |
|
Fig. 5 A comparison of the normalized line profile of the 658.0 GHz H2O line (solid line) with the ground state ortho-H2O line at 556.9 GHz (dotted red line) and the CO J = 6−5 (dashed blue line). |
| In the text | |
|
Fig. 6 Observed expansion velocity for molecular lines in our sample stars. |
| In the text | |
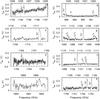 |
Fig. A.1 HIFI spectra of IRC+10011. For details of the lines detected, see Table A.1. |
| In the text | |
|
Fig. A.2 HIFI spectra of IRC+10011, continued. |
| In the text | |
|
Fig. A.3 HIFI spectra of o Cet. |
| In the text | |
|
Fig. A.4 HIFI spectra of IK Tau. |
| In the text | |
|
Fig. A.5 HIFI spectra of IK Tau, continued. |
| In the text | |
|
Fig. A.6 HIFI spectra of R Dor. |
| In the text | |
|
Fig. A.7 HIFI spectra of TX Cam. |
| In the text | |
|
Fig. A.8 HIFI spectra of WHya. |
| In the text | |
|
Fig. A.9 HIFI spectra of WHya, continued. |
| In the text | |
|
Fig. A.10 HIFI spectra of AFGL 5379. |
| In the text | |
|
Fig. A.11 HIFI spectra of OH 26.5+0.6. |
| In the text | |
|
Fig. A.12 HIFI spectra of R Cas. |
| In the text | |
Current usage metrics show cumulative count of Article Views (full-text article views including HTML views, PDF and ePub downloads, according to the available data) and Abstracts Views on Vision4Press platform.
Data correspond to usage on the plateform after 2015. The current usage metrics is available 48-96 hours after online publication and is updated daily on week days.
Initial download of the metrics may take a while.