Fig. 3
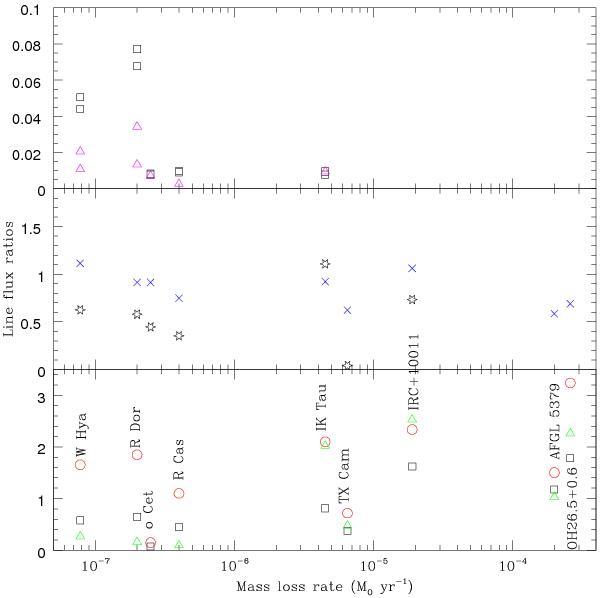
A plot of the line ratios relative to the integrated intensity of the CO J = 6 − 5 as a function of mass-loss rates. In the lower panel: for ortho-H2O 11,0 − 10,1 (squares), para-H2O 11,1 − 00,0 (circles), NH3 10 − 00 (triangles) scaled up by a factor of 5. The middle panel shows CO J = 10−9 ( × ), CO J = 16 − 15 (stars) and in the upper panel: SO (1313 − 1212) 559.3 and SO (1314 − 1213) 560.2 GHz (triangles) and SO2 (216,16 − 215,17) 558.4 and SO2 (371,37 − 360,36) 659.4 GHz (squares).
Current usage metrics show cumulative count of Article Views (full-text article views including HTML views, PDF and ePub downloads, according to the available data) and Abstracts Views on Vision4Press platform.
Data correspond to usage on the plateform after 2015. The current usage metrics is available 48-96 hours after online publication and is updated daily on week days.
Initial download of the metrics may take a while.