| Issue |
A&A
Volume 536, December 2011
|
|
|---|---|---|
| Article Number | A98 | |
| Number of page(s) | 7 | |
| Section | Interstellar and circumstellar matter | |
| DOI | https://doi.org/10.1051/0004-6361/201117516 | |
| Published online | 19 December 2011 | |
First high-resolution radio study of the supernova remnant G338.3-0.0 associated with the gamma-ray source HESS J1640–465
1 Instituto de Astronomía y Física del Espacio (CONICET-UBA), CC 67, Suc. 28, 1428 Buenos Aires, Argentina
e-mail: This email address is being protected from spambots. You need JavaScript enabled to view it.
2 Facultad de Ciencias Exactas y Naturales, Universidad de Buenos Aires, Argentina
3 Facultad de Arquitectura y Urbanismo, Universidad de Buenos Aires, Argentina
4 National Centre for Radio Astrophysics, Ganeshkhind, Pune 411007, India
5 APC-Univ. Denis Diderot Paris 7, 75265 Paris Cedex 13, France
Received: 18 June 2011
Accepted: 24 October 2011
Abstract
Aims. We perform a multifrequency radio study of the supernova remnant (SNR) G338.3−0.0, in positional coincidence with the TeV source HESS J1640 − 465. We study the morphological and spectral properties of this remnant and its surroundings searching for plausible radio counterparts to the gamma-ray emission.
Methods. We observed the SNR G338.3−0.0 using the Giant Metrewave Radio Telescope (GMRT) at 235, 610, and 1280 MHz. We also reprocessed archival data from the Australia Telescope Compact Array (ATCA) at 1290 and 2300 MHz. We conducted a search for radio pulsations towards a central point-like source, using the GMRT antennas at 610 and 1280 MHz. The molecular material in the region of the SNR was investigated based on observations made with the NANTEN telescope in the 12CO (J = 1–0) emission line.
Results. The new radio observations revealed a remnant with a bilateral morphology, which at 235 MHz has a western wing that is completely attenuated because of absorption caused by foreground ionized gas. The quality of these new images allows us to provide accurate estimates of the total radio flux density of the whole SNR at different radio frequencies. From both these new and existing flux density estimates between 235 MHz and 5000 MHz, we derived for the whole remnant a spectral index α = −0.51 ± 0.06 with a local free-free continuum optical depth at 235 MHz of τ235 = 0.9 ± 0.3. No radio pulsations were detected towards the only radio point-like source within the HESS error circle. We derived upper limits of 2.0 mJy and 1.0 mJy at 610 MHz and 1280 MHz, respectively, for the pulsed flux towards this source. No radio counterpart was found for the pulsar wind nebula discovered in X-rays. The inspection of the interstellar molecular gas towards G338.3−0.0 and its surroundings indicates that there is no associated dense cloud that might explain a hadronic origin for the TeV detection.
Key words: ISM: supernova remnants / radio continuum: ISM / ISM: individual objects: G338.3-0.0 / ISM: individual objects: HESS J1640-465
Member of the Carrera del Investigador Científico of CONICET, Argentina.
© ESO, 2011
1. Introduction
The very high energy (VHE) γ − ray source HESS J1640−465 was discovered by the HESS Cherenkov array during a Galactic survey in 2004 − 2006 (Aharonian et al. 2006). With an rms width of 2 , it is among the most compact sources in that survey. The spectrum is hard, with a photon index Γ ≃ 2.42, and a total integrated flux above 200 GeV of ~2.2 × 10⁻¹¹ erg cm-2 s-1 (Aharonian et al. 2006). In the same area, Slane et al. (2010) reported the detection with the Fermi-Large Area Telescope of the source 1FGL J1640.8−4634, which is likely to correspond to HESS J1640−465.
On the basis of XMM-Newton observations, Funk et al. (2007) identified a slightly extended (size ~ 0 45) hard spectrum X-ray emitting source (XMMU J164045.4 − 463131) at the centroid of the HESS source. This field was also investigated using the Chandra X-ray Observatory by Lemiere et al. (2009), who resolved the diffuse emission previously detected by XMM-Newton and revealed a bright point source inside (centered at J2000 RA =
  , Dec =
  ), labeled by the authors as S1. On the basis of its morphology and X-ray spectrum, the authors suggest that the X-ray point source is a putative pulsar and that the diffuse component is its associated pulsar wind nebula (PWN). Slane et al. (2010) interpret the Fermi-LAT observations as primarily originating in such a PWN.
The VHE source lies in the interior, close to the borders of G338.3−0.0, a shell-like radio supernova remnant (SNR). The remnant, which is about 8′ in size, is located in a complex region of the sky, rich in both non-thermal and thermal emission (Caswell & Haynes 1987). On the basis of HI absorption measurements and assuming that the SNR is at the same distance as the neighboring HII regions, a distance of between ~8.5 kpc and 13 kpc was suggested for G338.3−0.0 (Lemiere et al. 2009). Following Lemiere et al. (2009), we assume for our calculations a distance to G338.3−0.0 of 10 kpc.
Until now, the observations carried out have failed to unambiguously confirm the connection between G338.3−0.0 and HESS J1640 − 465. In this paper, we present new and reprocessed data at 235, 610, 1280, and 2300 MHz that were acquired with the Giant Metrewave Radio Telescope (GMRT) and ATCA, to investigate the SNR and search for a radio counterpart to the proposed pulsar and PWN observed in X-rays.
2. Observations and data reduction
2.1. GMRT observations
We performed low frequency observations of the SNR G338.3−0.0 at 235, 610, and 1280 MHz using the GMRT. Simultaneous dual frequency observations were carried out at 235 and 610 MHz during two sessions of six hours on 26 and 27 February 2008. Data in the 1280 MHz band were obtained on 29 February and 1 March 2008 for a total of seven hours of observing time on G338.3−0.0. To permit the removal of radio frequency interference (RFI) from the data, observations at 610 and 1280 MHz were performed for both the upper and lower sidebands each of which with a total bandwidth of 16 MHz split into 128 spectral channels. At 235 MHz, the data were collected for only the upper sideband using 64 channels over a total bandwidth of 8 MHz.
At the three frequencies, the absolute amplitude scale was set using the calibrator 3C 286. Bandpass calibration was in all cases achieved by observing the source 1830 − 360. In the 235/610 MHz observations, 1625 − 311 was used as a phase calibrator, whereas 1626 − 298 was the secondary calibrator for the 1280 MHz data. Automatic measurements of the variations in the system temperatures of the antennas at the GMRT were not implemented during the observations. These changes in temperature may become significant when observing the Galactic plane region at low radio frequencies. Additional correction factors (ranging from 1.1 to 2, with the highest value ocurring at 235 MHz) applied to each dataset after imaging were estimated using interpolated values of sky temperatures from the 408 MHz all-sky continuum survey of Haslam et al. (1982) and assuming a spectral index β = −2.7 for the Galactic background emission.
The data from each day were fully reduced and imaged separately to ensure that there were no day-to-day amplitude discrepancies. In the case of the 610 and 1280 MHz observations, the data from each of the two available sidebands were also reduced independently. To perform this work, we made use of the NRAO Astronomical Image Processing Software (AIPS) package following a similar procedure for each observed frequency. After initial calibration, the data for each sideband at 235, 610, and 1280 MHz were averaged in terms of frequency by collapsing the bandwidth to a number of five, eleven, and three spectral channels, respectively. The individually calibrated 235 MHz datasets from each day were then concatenated. At 610 and 1280 MHz, before combining data from each day, the data recorded for the upper and lower sidebands were combined into a single uv dataset using the tasks UVFLP and BLOAT within AIPS and imaged as outlined below (Garn et al. 2007).
To reduce the w-term effect imposed by the large field of view associated with low-frequency radio observations (the primary beam of the telescope at 610 and 235 MHz is ~ 0 8 and ~ 2°, respectively), we employed wide-field imaging as implemented in the AIPS task IMAGR. To deal with ionospheric-based phase variations, which decorrelate phases across the full field of view, we employed several rounds of phase-only self-calibration and a final phase and amplitude self-calibration to the visibility data at 235, 610, and 1280 MHz. The final calibrated visibility data at 235 MHz were combined into a single uv dataset and imaged using a SDI Clean algorithm. All the deconvolved images were finally corrected for primary beam attenuation. The properties of the final images are summarized in Table 1.
2.2. ATCA archival data
The 1280 MHz GMRT observations are sensitive to structures with angular scales as large as 490λ ≃ 7 arcmin. To improve the uv coverage, we combined the GMRT data in the uv plane with archival ATCA data acquired in the same radio band in November and December 2005 with the array operating in two different configurations (750D and 1.5C). The region was imaged in the mosaic mode with five different pointings. The ATCA data were taken simultaneously at 1290 and 2300 MHz. For all observations, PKS 1934 − 638 and PKS 1740 − 517 were used as a primary flux density and a secondary phase calibrator, respectively. The shortest array spacing of the ATCA data was 31 m corresponding to a maximum angular scale to which the observations were sensitive as large as ~26 and ~14 arcmin at 1290 and 2300 MHz, respectively. The final angular resolution and sensitivity of the image at 1280 MHz formed from the combination of GMRT and ATCA data with the image at 2300 MHz are listed in Table 1.
Properties of the full-resolution images of SNR G338.3−0.0.
To investigate in detail the radio emission around the X-ray pulsar candidate in a search for traces of a PWN, we reprocessed 4800 and 8640 MHz data corresponding to observations acquired with the ATCA telescope in the 750D configuration in 1999. These data are only useful for the study of structures smaller than 7 arcmin at 4800 MHz and 4 arcmin at 8640 MHz, which correspond to the largest angular scales that can be reliably imaged with the array at these high frequencies.
3. Search for a radio pulsar
From the archival ATCA observations carried out in the direction of G338.3−0.0 at 4800 and 8640 MHz, we detected a point-like source located near the proposed X-ray pulsar XMMUJ164045.4−463131 (Funk et al. 2007), unresolved down to the 3′′ × 1′′ interferometric beam. This radio source, centered at RA = 16h 40m 48s, Dec = −46°31′58′′ (J2000), has a flux density of about 6 mJy and 4.5 mJy at 4800 and 8640 MHz, respectively, and a radio spectral index α ~ −0.5 (S ∝ να). At our current spatial resolution and sensitivity, we note that this is the only radio point source present in the vicinity of the X-ray compact source. Though its radio spectral index is not typical of a pulsar, separate time series observations towards this point source were nevertheless carried out for completeness, in our search for radio pulses.
The observations were conducted using the GMRT at 610 and 1280 MHz on 24 and 25 February 2008, respectively. On both of these days, we used 25 antennas of GMRT configured in an incoherent array with a total bandwidth of 16 MHz. The FWHM for this configuration was 40′ and 20′ for 610 and 1280 MHz, respectively, centered on the point source mentioned above. This beam also covers the source S1 discovered by Lemiere et al. (2009) one year later. We also used 16 antennas located in the compact central square array of GMRT in a phased array mode synthesizing a more sensitive beam with FWHM of about 40′′ and 20′′ at 610 and 1280 MHz respectively, centered on the point source. The time series data were sampled every 256 microsec. The data were simultaneously acquired with an incoherent array and a phased array. This choice of observing configuration not only allowed us to perform more sensitive observations of the point source using the phased array, but also to look for other related sources in the primary beam with the incoherent array, such as the aforementioned source S1. Observations at 610 MHz were motivated by a search for sources, which may be related to the SNR, with a steeper spectra than the point source.
 |
Fig. 1 New radio continuum images from the SNR G338.3−0.0. The contours and the linear intensity scales have been chosen to emphasize the relevant features at each frequency. The wedges display in mJy beam-1 the values of the radio emission at each frequency. All images were aligned to the same pixel position. The coordinates displayed in Fig. 1b are the same for the other three panels. a) GMRT image at 235 MHz. The emission towards the western hemisphere is significantly fainter at this frequency. The contours are traced at 36, 50, 60, 74, 90, and 120 mJy beam-1. b) GMRT image at 610 MHz. The intensity contours correspond to 3.5, 5, 6, 7, 8.5, and 10 mJy beam-1. c) Radio emission at 1280 MHz from GMRT and ATCA data. The contours are traced at 4, 5, 6, 8, and 10 mJy beam-1. d) The 2300 MHz image obtained from reprocessed archival ATCA data. The radio contours are traced at 2, 3, 4, and 6 mJy beam-1. All the displayed images include primary beam correction. The synthesized beams, position angle, and noise levels are listed in Table 1. The white dashed circle included in Fig. 1b shows the position and size of the VHE gamma-ray source HESS J1640 − 465. The plus sign in each panel marks the position of the X-ray source S1 identified by Lemiere et al. (2009). |
The data were analyzed using the SIGPROC1 pulsar data analysis software on 128 processors within the high performance computer cluster currently in use at the National Centre for Radio Astrophysics. The data were dedispersed for 512 trial dispersion measures (DMs) with DMs ranging from 0 to about 465 pc cm-3 at 610 MHz. The DMs were spaced more coarsely at 1280 MHz, owing to the smaller amount of dispersion smearing across each individual frequency channel. At this frequency, the dedispersion search was made in 160 steps using DMs between 0 and 660 pc cm-3. We searched for periodicities in the dedispersed time series using a standard harmonics search and used a threshold signal-to-noise ratio (S/N) of eight. Interference periodicities corresponding to power-line RFI as well as other known RFI were eliminated. After a careful examination of the profiles for the candidates produced by search processing, we did not find any characteristic periodic signal, as expected for a pulsar.
A calibrator source, 1830 − 360, was also observed using both the incoherent and phased array. This source was used to estimate the rms noise in the time series. The upper limit to the flux density of any pulsar in our field of view with S/N of eight times rms were estimated to be 2 and 1 mJy for 610 and 1280 MHz, respectively. Therefore, though our observations did not reveal pulsations from an intense source, they do not rule out a pulsar fainter than the limits quoted above. In addition, the pulsed radiation may be beamed away from our line of sight.
With a spectral index of − 0.5, which is much less steeper than the average pulsar spectral index of about − 1.8 (Maron et al. 2000), our limits on the pulsed radiation imply that the radio point source, shown in Fig. 1 must be unrelated. Source S1 may be a radio pulsar, but is either fainter than our limits or beamed away. Finally, the high sky background and large interstellar scattering at a distance of 10 kpc could also lead to non-detection of pulsed radiation, particularly for periods shorter than 100 ms, owing to scatter-broadening of the radio pulse.
4. New radio images of G338.3−0.0
In Fig. 1, we present close-up views of a portion of the field mapped with GMRT at low radio frequencies plus the ATCA reprocessed data, showing the detailed morphology of G338.3−0.0 at 235, 610, 1280, and 2300 MHz. These are the first high-resolution images of the source that provide unprecedented sensitivity to the radio emission. The shortest baseline in the GMRT central square for which the data at 235 and 610 MHz were reliable correspond to ~86λ and ~230λ respectively, which is equivalent to structures with angular scales of up to 40 and 15 arcmin. This fact ensures that the contributions from the largest spatial scales have been adequately recovered for this SNR, which is about 8′ in size. In particular, the GMRT 610 MHz image (Fig. 1b) improves by a factor of six the angular resolution and by a factor of seven the sensitivity in comparison with the only previously known image of this remnant at 843 MHz (Whiteoak & Green 1996). For data at 1280 MHz, since G338.3−0.0 is almost at the limit of the largest imaged structures we incorporated the shortest spacing information available from archival ATCA observations to avoid missing any large-scale flux density in the image at this frequency, as described in Sect. 2.2.
Except for the radio image at 235 MHz, where most of the western half is completely attenuated, the total intensity images at 610, 1280, and 2300 MHz are quite similar in appearance, revealing a supernova remnant with a clear bilateral morphology. A considerable number of small-scale features, including bright knots, are evident in the new images along the entire shell, with their respective brightness varying across the spectrum. Diffuse emission is also observed inside the radio shell, particularly close to the eastern radio shell.
The large sky field mapped at 610 MHz allows us to get a picture of the different sources emitting around G338.3−0.0. In Fig. 2, we present the radio emission at 610 MHz in an area of about 0.5 square degrees. Several HII regions are evident in the field. The position and extension of the cataloged thermal regions (from Caswell & Haynes 1987; Paladini et al. 2003) are indicated in Fig. 2 by white dashed circles. From this figure, it is obvious that the remnant lies in a complex region of our Galaxy with an intricate network of non-thermal and thermal structures, with ample regions of the SNR shell covered by the HII regions G338.45+0.06 and G338.4+00.0.
To accurately establish the flux density and hence the spectral properties of the SNR emission, it is very important to disentangle thermal from non-thermal contributions. To carry out this task, we made use of the Spitzer GLIMPSE and MIPSGAL infrared data. In Fig. 3, we present a direct comparison of the IR emission with the new GMRT 610 MHz image in the spatial region around G338.3−0.0. The emission in the 8 and 24 μm infrared bands are excellent tracers of warm dust associated with star-forming regions, which are usually related to thermal radio emission.
Figure 3 clearly demonstrates that the entire complex of HII regions located to the north of G338.3−0.0 with an extent of about 12′ in the sky, is prominent in both radio and the two IR bands. In addition to the aforementioned thermal emission, two infrared condensations particularly bright in 24 μm, are observed overlapping the SNR. One located on the southern extreme of the western shell and the other near the center of the eastern half of the remnant. These sources with both strong infrared and radio emission are probably normal or ultracompact HII regions overlapping the non-thermal SNR emission. Another noticeable structure is a bright ring of infrared 8 μm and 24 μm emission located on the northwestern portion of the SNR, which appears to outline precisely an enhancement in the radio band. This feature was first identified at infrared wavelengths using GLIMPSE data by Churchwell et al. (2006), who proposed that it is the projection of a fully enclosed three-dimensional bubble (designated S33 in Churchwell et al.’s catalog) with an angular diameter of about 0.9 arcmin. The composite image also reveals the presence of faint infrared emission at 8 μm along the northwestern boundary, within the error circle of the VHE source HESS J1640 − 465. We also investigated the near-infrared emission using the 3.6 μm, 4.5 μm, and 5.8 μm Infrared Array Camera (IRAC) data from the GLIMPSE Science Program but no emission above the noise is detected in this region.
 |
Fig. 2 Radio continuum image at 610 MHz of a large area around the SNR G338.3−0.0, showing several nearby thermal sources encircled by dashed white lines to highlight their locations. The intensity scale is based on a linear relation from 2.4 to 8 mJy beam-1. |
 |
Fig. 3 A comparison of the radio continuum emission at 610 MHz (in blue) from the region around SNR G338.3−0.0 and the infrared emission at 8 μm (in green) and 24 μm (in red) taken from the Spitzer Space Telescope GLIMPSE and MIPSGAL surveys, respectively. The white circle marks the position and extension of HESS J1640 − 465, while the cross indicates the location of the X-ray source S1 (Lemiere et al. 2009). |
With this information, we attempt to provide accurate estimates for the flux densities over the whole SNR G338.3−0.0 at 235, 610, 1280, and 2300 MHz. In addition, we used the image of this SNR acquired at 843 MHz with the MOST telescope and the image at 5000 MHz taken from Parkes 64-m telescope archival data to extract additional values of the flux density. Our estimate of the flux density at 843 MHz is in good agreement, within the uncertainties, with that reported by Whiteoak & Green (1996).
These flux density estimates are corrected by a background level that was determined at each frequency by tracing one-dimensional plots of the intensity as a function of position in selected slices around the shell of the SNR. We note a dependence on the direction of measurement of the background emission especially for the images at 1280 and 2300 MHz, for which variations of a few tens of mJy beam-1 were calculated between the east and west directions of the radio shell. The values estimated in this way were then subtracted from the integrated flux density at each frequency. An extra contribution from the thermal emission was also subtracted from the integrated flux density measurements. This contribution was estimated based on the comparison of our radio image with the infrared data by integrating the infrared flux in the bright regions overlapping the SNR and determining their respective fluxes at the observed radio frequencies by assuming a spectral index of about α ~ −0.1 for the thermal emission. Table 2 gives the integrated flux density measurements for G338.3−0.0 from 235 to 5000 MHz. In the second column, we list the results obtained by directly measuring the flux density from the image at each frequency. The listed flux densities represent the average from different measurements carried out using slightly different contours to enclose the SNR emitting region. In Cols. 3 and 4, we summarize the background and thermal emission contributions, while the final flux density values after subtracting these contributions are listed in the fifth column of Table 2. The results in this table have been placed on the same absolute flux density scale as Baars et al. (1977).
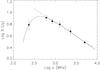 |
Fig. 4 Integrated radio continuum spectra of the SNR G338.3−0.0 obtained from the flux density values listed in Table 2 (Col. 5). The dashed line is the best fit to the flux density measurements at frequencies higher than 235 MHz, which gives an integrated spectral index α = −0.47 ± 0.05. The solid line is the fit to the data using Eq. (1), which takes into account a low frequency turnover due to absorption by foreground thermal gas. This method yields a global spectral index for G338.3−0.0 α = −0.51 ± 0.06. |
Figure 4 shows the radio continuum spectrum of G338.3−0.0 from the flux densities summarized in Table 2. There is a clear sign of a low frequency turnover in this spectrum, which is likely to be caused by the emission associated with the intervening thermal gas. We first used a single power-law spectrum excluding the flux density value at 235 MHz to determine the integrated spectral index of the remnant (represented as a dashed line in Fig. 4). A weighted fit yields a spectral index α = −0.47 ± 0.05 (S ∝ να), which is typical of shell-type SNRs. In addition, to determine the properties of the gas whose emission is responsible for the observed turnover, we used all the integrated flux measurements, to make a weighted fit to the equation (indicated by the solid line in Fig. 4) ![Mathematical equation: \begin{equation} S_{\nu}=S_{408}\,\left(\frac{\nu}{408~\mathrm{MHz}}\right)^{\alpha}\, \mathrm{exp}\left[-\tau_{408}\left(\frac{\nu}{408~\mathrm{MHz}}\right)^{-2.1}\right], \label{flux} \end{equation}](/articles/aa/full_html/2011/12/aa17516-11/aa17516-11-eq43.png) (1)where Sν(Jy) represents the flux density at the frequency ν(MHz). The parameters S408 and τ408 are the flux density and the average optical depth at the fiducial frequency of 408 MHz. This equation assumes a constant spectral index α for the synchrotron emission over the entire radio band, allowing for a turnover at the lowest frequencies (Kassim 1989). The best-fit model parameters are S408 = 11.2 ± 1.3 Jy and α = −0.51 ± 0.06, whereas the best-fit value of the free-free continuum optical depth is τ408 = 0.28 ± 0.08. The average optical depth at 235 MHz estimated from τν = τ408 [ν/408] -2.1 is 0.9 ± 0.3, which should be considered as an upper limit because the low frequency turnover observed in the spectrum of Fig. 4 occurs near the lowest observed frequency, resulting in a possible overestimation (Kassim 1989). Accurate flux density measurements of G338.3−0.0 at very low frequencies ( ≤ 100 MHz) would be highly desirable to establish the frequency dependence of the spectrum in this region. The derived spectral properties of G338.3−0.0 are not surprising given that, as we have shown in Fig. 2, the remnant lies in a site that hosts numerous HII regions. Thus, the contamination by ionized gas from these HII regions (or their envelopes) along the line of sight constitutes a potential source of extrinsic free-free absorption towards the SNR.
(1)where Sν(Jy) represents the flux density at the frequency ν(MHz). The parameters S408 and τ408 are the flux density and the average optical depth at the fiducial frequency of 408 MHz. This equation assumes a constant spectral index α for the synchrotron emission over the entire radio band, allowing for a turnover at the lowest frequencies (Kassim 1989). The best-fit model parameters are S408 = 11.2 ± 1.3 Jy and α = −0.51 ± 0.06, whereas the best-fit value of the free-free continuum optical depth is τ408 = 0.28 ± 0.08. The average optical depth at 235 MHz estimated from τν = τ408 [ν/408] -2.1 is 0.9 ± 0.3, which should be considered as an upper limit because the low frequency turnover observed in the spectrum of Fig. 4 occurs near the lowest observed frequency, resulting in a possible overestimation (Kassim 1989). Accurate flux density measurements of G338.3−0.0 at very low frequencies ( ≤ 100 MHz) would be highly desirable to establish the frequency dependence of the spectrum in this region. The derived spectral properties of G338.3−0.0 are not surprising given that, as we have shown in Fig. 2, the remnant lies in a site that hosts numerous HII regions. Thus, the contamination by ionized gas from these HII regions (or their envelopes) along the line of sight constitutes a potential source of extrinsic free-free absorption towards the SNR.
By applying appropriate uv-tapering, to match the range of spatial scales measured at 235 and 610 MHz, we studied the dependence on the position across the face of the remnant of the optical depth at the lowest frequency. As expected, the higher values of this magnitude correspond to the western and northwestern part of the SNR, where τ235 varies between 1 and 2. On the basis of this result and our spectral analysis, we can derive the physical properties of the thermal plasma responsible for the observed attenuation in the western part of the SNR. We conclude that if the electron temperature varies across the typical range for HII regions (from 5000 to 10 000 K) and if the absorbing gas has a depth along the line of sight comparable to its transverse size, at the assumed distance of 10 kpc, the emission measure varies between 0.1 and 0.3 × 10⁶ pc cm-6 in the region where the absorption is stronger, and the electron density is in the range 100 to 165 cm-3.
Flux density estimates for the SNR G338.3−0.0.
5. Search for a PWN in G338.3−0.0
On the basis of our new radio images, we have searched for a counterpart to the observed X-ray emission interior to the SNR radio shell, which had been previously proposed to be a PWN (Funk et al. 2007; Lemiere et al. 2009). However, down to the noise level of our data at each frequency we have been unable to detect any radio emission associated with the X-ray PWN. In contrast, instead of the expected nebular enhancement, a depression in the emission is observed at 610 MHz in the area covered by the X-ray nebula. In spite of the complex nature of the emission in this region, there is no reason to suspect a deficit in the recovered flux density, since observations at this frequency were made with very good spatial coverage and no overlap is evident between the thermal emission and the X-ray nebula. We can therefore only place upper and lower limits on the radio flux density by assuming in our calculation that particles originate close to the X-ray point source and then disperse in a nebula whose extent in radio is, at least, comparable to that of the X-ray nebula in G338.3−0.0. The most robust constraint on the flux is ~6 mJy obtained from the image at 610 MHz as it represents the lowest of all the flux density measurements.
Assuming a PWN radio spectral index of α = −0.3 (Gaensler et al. 2000), the mentioned flux at 610 MHz corresponds to a broadband radio luminosity integrated between 108 and 1012 Hz of LR ~ 6 × 1032 erg s-1 (at a distance of 10 kpc), where the upper cutoff frequency considered in this calculation is obtained from the spectral break between radio and X-rays from the XMM-Newton observations (Funk et al. 2007). In this case, the derived radio luminosity for this object is distinctly fainter than the typical value of LR ~ 1034 erg s-1 observed in other radio PWNe (Gaensler & Slane 2006). In contrast, a higher luminosity of LR ~ 9.0 × 1034 erg s-1 is obtained if, the upper cutoff is derived from the fit between radio and Chandra data (Lemiere et al. 2009), i.e. a lower and upper cutoff frequency of 108 Hz and 1016 Hz, respectively, are used in the calculation. This latter result, however, is at odds with the non-detection of a radio nebula in the region. The dramatic difference between the calculated luminosities comes from the uncertainty in the frequency at which the spectral break between radio and X-rays takes place, which is due to the quite different X-ray slopes quoted in the literature. To reproduce the broad-band emission, Funk et al. (2007) proposed a time-dependent rate injection of relativistic electrons in which the X-ray emitting region is produced by the youngest particles (t < 2000 yr), while an older population of electrons injected early in the formation of the PWN dominates the VHE γ-ray emission. In this scenario, if the population of youngest electrons also dominates the radio emission, the values of the radio flux densities would fall well below the sensitivity limit of current observations, which is compatible with our non-detection of the radio PWN.
6. The environmental molecular gas
In our search for an alternative explanation of the observed γ-ray emission from G338.3−0.0, we analyzed the 12CO (J = 1 − 0) molecular line emission in its vicinity based on data taken from the CO survey carried out with the 4-m NANTEN telescope operated in Las Campanas Observatory (Chile). These observations have a HPBW of 2.7 arcmin, a grid spacing of 4 arcmin, and a velocity resolution of 1 km s-1.
After carefully inspecting the complete 12CO data cube, we did not find any molecular cloud that, based on morphological correspondence, might be associated with either the source HESS J1640 − 465 or the SNR radio shell, at least down to the limits of both sensitivity and resolution of the CO survey used. Deeper molecular observations would be very useful to investigate the likelihood of a hadronic origin for the observed γ-ray emission.
7. Summary
We have presented in this paper a multi-frequency dataset of the highest angular resolution and sensitivity for the radio continuum emission towards the SNR G338.3−0.0. A mixture of synchrotron radiation from the remnant and unrelated overlapping thermal gas has been detected in the mapped region. The quality of our new images provides for the first time robust estimates of the total radio flux density across the whole SNR at four radio frequencies. On the basis of these images, we have studied the global radio continuum spectrum of the remnant and found a clear indication of a low frequency turnover. We have concluded that a foreground sheet of ionized gas is absorbing the radio synchrotron emission coming from almost half of the radio SNR shell. We conclude that this absorption is associated with the complex of HII regions that is in close proximity to the remnant.
We have also identified a previously uncataloged point-like radio source near the centroid of the TeV source HESS J1640 − 465, close to the compact object detected in X-rays (Lemiere et al. 2009) and considered by these authors as a putative pulsar that might be powering a PWN detected in X-rays. No pulsed emission either associated with the radio point source, or within the field of view, has been detected up to a continuum flux density of 2.0 and 1.0 mJy at 610 and 1280 MHz, respectively. In addition, no nebular radio emission has been found to correspond to the X-ray PWN, in spite of the good quality of our radio images down to low surface brightness limits. In this context, we have only been able to set an upper limit on the radio emission at 610 MHz over a region with an area comparable to that of the PWN seen in X-rays.
Finally, we analyzed the environmental conditions for a hadronic origin of the γ-ray emission. We conclude that no bright molecular matter appears to overlap either the source HESS J1640 − 465 or the SNR radio shell.
In summary, these radio observations fail to support the idea of an association between the SNR and/or its PWN with the emission observed in the γ-rays range. A physical mechanism that produces only high energy photons should be proposed to help us explain the observations across the electromagnetic spectrum.
More information available at http://sigproc.sourceforge.net
Acknowledgments
We acknowledge the referee for his/her constructive comments. We thank Prof. Fukui Y. for kindly providing us with the NANTEN data. GMRT is operated by the National Centre for Radio Astrophysics of the Tata Institute of Fundamental Research. Pulsar search processing was carried out on NCRA’s High Performance Cluster and authors acknowledge assistance from V. Venkatsubramani and his cluster team. This work is based, in part, on observations made with the Spitzer Space Telescope, which is operated by the Jet Propulsion Laboratory, California Institute of Technology under a contract with NASA. G.G. acknowledge financial support from User Community Development. This research has made use of the NASA’s ADS
Bibliographic Services. Data processing was carried out using the HOPE PC cluster at IAFE. This research was partially funded through the following grants: CONICET (Argentina) PIP 112-200801-02166, ANPCYT-PICT (Argentina) 0902/07, ANPCYT-PICT (Argentina) 2008-0795, and UBACYT.
References
- Aharonian, F., Akhperjanian, A. G., Bazer-Bachi, A. R., et al. 2006, ApJ, 636, 777 [Google Scholar]
- Baars, J. W. M., Genzel, R., Pauliny-Toth, I. I. K., & Witzel, A. 1977, A&A, 61, 99 [NASA ADS] [Google Scholar]
- Caswell, J. L., & Haynes, R. F. 1987, A&A, 171, 261 [NASA ADS] [Google Scholar]
- Churchwell, E., Povich, M. S., Allen, D., et al. 2006, ApJ, 649, 759 [NASA ADS] [CrossRef] [Google Scholar]
- Funk, S., Hinton, J. A., Pühlhofer, G., et al. 2007, ApJ, 662, 517 [NASA ADS] [CrossRef] [Google Scholar]
- Gaensler, B. M., & Slane, P. O. 2006, ARA&A, 44, 17 [NASA ADS] [CrossRef] [Google Scholar]
- Gaensler, B. M., Stappers, B. W., Frail, D. A., et al. 2000, MNRAS, 318, 58 [NASA ADS] [CrossRef] [Google Scholar]
- Garn, T., Green, D. A., Hales, S. E. G., Riley, J. M., & Alexander, P. 2007, MNRAS, 376, 1251 [NASA ADS] [CrossRef] [Google Scholar]
- Haslam, C. G. T., Salter, C. J., Stoffel, H., & Wilson, W. E. 1982, A&AS, 47, 1 [NASA ADS] [Google Scholar]
- Kassim, N. E. 1989, ApJ, 347, 915 [NASA ADS] [CrossRef] [Google Scholar]
- Lemiere, A., Slane, P., Gaensler, B. M., & Murray, S. 2009, ApJ, 706, 1269 [NASA ADS] [CrossRef] [Google Scholar]
- Maron, O., Kijak, J., Kramer, M., & Wielebinski, R. 2000, A&AS, 147, 195 [NASA ADS] [CrossRef] [EDP Sciences] [Google Scholar]
- Slane, P., Castro, D., Funk, S., et al. 2010, ApJ, 720, 266 [NASA ADS] [CrossRef] [Google Scholar]
- Whiteoak, J. B. Z., & Green, A. J. 1996, A&AS, 118, 329 [NASA ADS] [CrossRef] [EDP Sciences] [Google Scholar]
All Tables
All Figures
|
Fig. 1 New radio continuum images from the SNR G338.3−0.0. The contours and the linear intensity scales have been chosen to emphasize the relevant features at each frequency. The wedges display in mJy beam-1 the values of the radio emission at each frequency. All images were aligned to the same pixel position. The coordinates displayed in Fig. 1b are the same for the other three panels. a) GMRT image at 235 MHz. The emission towards the western hemisphere is significantly fainter at this frequency. The contours are traced at 36, 50, 60, 74, 90, and 120 mJy beam-1. b) GMRT image at 610 MHz. The intensity contours correspond to 3.5, 5, 6, 7, 8.5, and 10 mJy beam-1. c) Radio emission at 1280 MHz from GMRT and ATCA data. The contours are traced at 4, 5, 6, 8, and 10 mJy beam-1. d) The 2300 MHz image obtained from reprocessed archival ATCA data. The radio contours are traced at 2, 3, 4, and 6 mJy beam-1. All the displayed images include primary beam correction. The synthesized beams, position angle, and noise levels are listed in Table 1. The white dashed circle included in Fig. 1b shows the position and size of the VHE gamma-ray source HESS J1640 − 465. The plus sign in each panel marks the position of the X-ray source S1 identified by Lemiere et al. (2009). |
| In the text | |
|
Fig. 2 Radio continuum image at 610 MHz of a large area around the SNR G338.3−0.0, showing several nearby thermal sources encircled by dashed white lines to highlight their locations. The intensity scale is based on a linear relation from 2.4 to 8 mJy beam-1. |
| In the text | |
|
Fig. 3 A comparison of the radio continuum emission at 610 MHz (in blue) from the region around SNR G338.3−0.0 and the infrared emission at 8 μm (in green) and 24 μm (in red) taken from the Spitzer Space Telescope GLIMPSE and MIPSGAL surveys, respectively. The white circle marks the position and extension of HESS J1640 − 465, while the cross indicates the location of the X-ray source S1 (Lemiere et al. 2009). |
| In the text | |
|
Fig. 4 Integrated radio continuum spectra of the SNR G338.3−0.0 obtained from the flux density values listed in Table 2 (Col. 5). The dashed line is the best fit to the flux density measurements at frequencies higher than 235 MHz, which gives an integrated spectral index α = −0.47 ± 0.05. The solid line is the fit to the data using Eq. (1), which takes into account a low frequency turnover due to absorption by foreground thermal gas. This method yields a global spectral index for G338.3−0.0 α = −0.51 ± 0.06. |
| In the text | |
Current usage metrics show cumulative count of Article Views (full-text article views including HTML views, PDF and ePub downloads, according to the available data) and Abstracts Views on Vision4Press platform.
Data correspond to usage on the plateform after 2015. The current usage metrics is available 48-96 hours after online publication and is updated daily on week days.
Initial download of the metrics may take a while.