Fig. 1
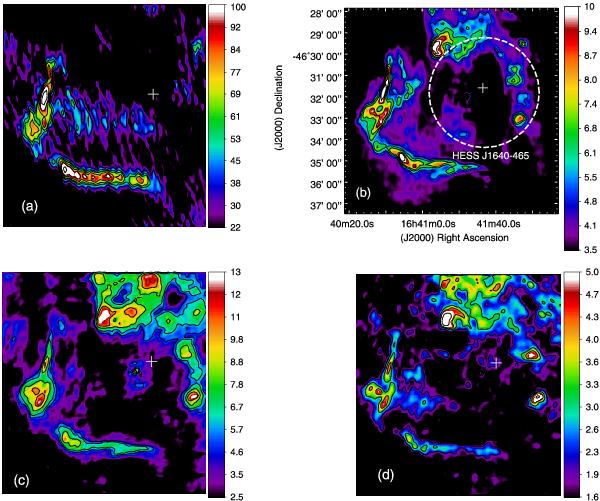
New radio continuum images from the SNR G338.3−0.0. The contours and the linear intensity scales have been chosen to emphasize the relevant features at each frequency. The wedges display in mJy beam-1 the values of the radio emission at each frequency. All images were aligned to the same pixel position. The coordinates displayed in Fig. 1b are the same for the other three panels. a) GMRT image at 235 MHz. The emission towards the western hemisphere is significantly fainter at this frequency. The contours are traced at 36, 50, 60, 74, 90, and 120 mJy beam-1. b) GMRT image at 610 MHz. The intensity contours correspond to 3.5, 5, 6, 7, 8.5, and 10 mJy beam-1. c) Radio emission at 1280 MHz from GMRT and ATCA data. The contours are traced at 4, 5, 6, 8, and 10 mJy beam-1. d) The 2300 MHz image obtained from reprocessed archival ATCA data. The radio contours are traced at 2, 3, 4, and 6 mJy beam-1. All the displayed images include primary beam correction. The synthesized beams, position angle, and noise levels are listed in Table 1. The white dashed circle included in Fig. 1b shows the position and size of the VHE gamma-ray source HESS J1640 − 465. The plus sign in each panel marks the position of the X-ray source S1 identified by Lemiere et al. (2009).
Current usage metrics show cumulative count of Article Views (full-text article views including HTML views, PDF and ePub downloads, according to the available data) and Abstracts Views on Vision4Press platform.
Data correspond to usage on the plateform after 2015. The current usage metrics is available 48-96 hours after online publication and is updated daily on week days.
Initial download of the metrics may take a while.