Free Access
Fig. 2
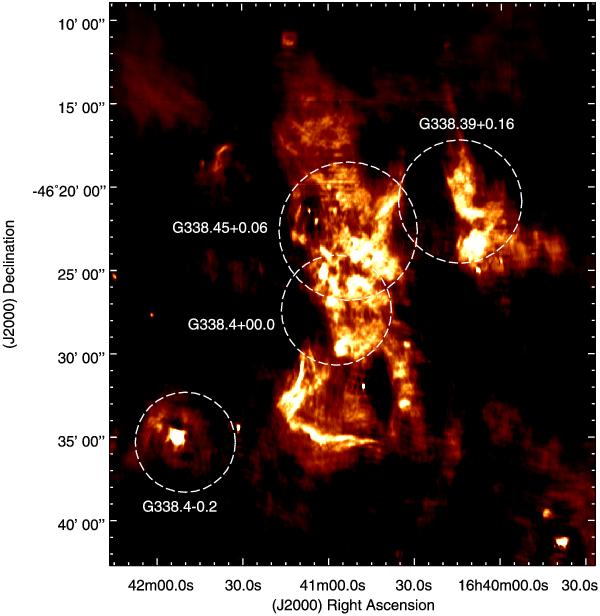
Radio continuum image at 610 MHz of a large area around the SNR G338.3−0.0, showing several nearby thermal sources encircled by dashed white lines to highlight their locations. The intensity scale is based on a linear relation from 2.4 to 8 mJy beam-1.
Current usage metrics show cumulative count of Article Views (full-text article views including HTML views, PDF and ePub downloads, according to the available data) and Abstracts Views on Vision4Press platform.
Data correspond to usage on the plateform after 2015. The current usage metrics is available 48-96 hours after online publication and is updated daily on week days.
Initial download of the metrics may take a while.