Fig. 4
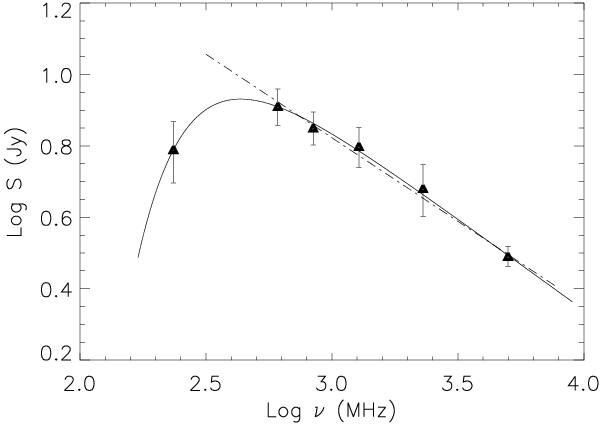
Integrated radio continuum spectra of the SNR G338.3−0.0 obtained from the flux density values listed in Table 2 (Col. 5). The dashed line is the best fit to the flux density measurements at frequencies higher than 235 MHz, which gives an integrated spectral index α = −0.47 ± 0.05. The solid line is the fit to the data using Eq. (1), which takes into account a low frequency turnover due to absorption by foreground thermal gas. This method yields a global spectral index for G338.3−0.0 α = −0.51 ± 0.06.
Current usage metrics show cumulative count of Article Views (full-text article views including HTML views, PDF and ePub downloads, according to the available data) and Abstracts Views on Vision4Press platform.
Data correspond to usage on the plateform after 2015. The current usage metrics is available 48-96 hours after online publication and is updated daily on week days.
Initial download of the metrics may take a while.