Fig.2
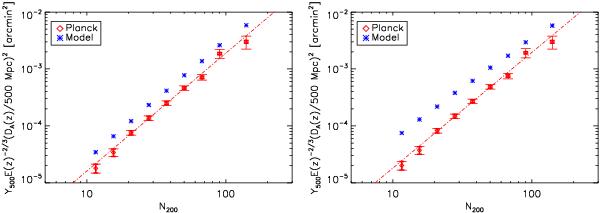
Scaled SZ signal measurements,  , binned by richness, N200. The left-hand panel presents the results for the Johnston et al. (2007)M500 − N200 relation, the right-hand panel for the Rozo et al. (2009) relation. In each case, the red diamonds show the bin-average, redshift-scaled calculated as the weighted mean of all individual measurements (e.g., Fig. 1) in the bin, where the weights are taken from the estimated filter noise. The thick error bars show the corresponding uncertainty on the bin-average SZ signal, while the lighter error bars indicate the uncertainty found by bootstrap analysis; they are larger due to the presence of intrinsic scatter within the bins, most notable at high richness (see Fig. 4). The blue points represent the model prediction for each bin found by averaging, with the same weights as the data, the SZ signal expected from the Y500 − M500 (Arnaud et al. 2010, STD case) and corresponding M500 − N200 relations. The Planck measurements are little affected by choice of mass-richness relation, while the model points move significantly upward with the Rozo et al. (2009) mass calibration. Dashed lines in both panels show the best fit power-law to the Planck individual cluster data points (i.e., prior to binning, as shown in Fig. 1); the parameters for these fits are given in Table 2.
Current usage metrics show cumulative count of Article Views (full-text article views including HTML views, PDF and ePub downloads, according to the available data) and Abstracts Views on Vision4Press platform.
Data correspond to usage on the plateform after 2015. The current usage metrics is available 48-96 hours after online publication and is updated daily on week days.
Initial download of the metrics may take a while.