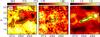
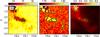
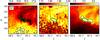
Fig. 3
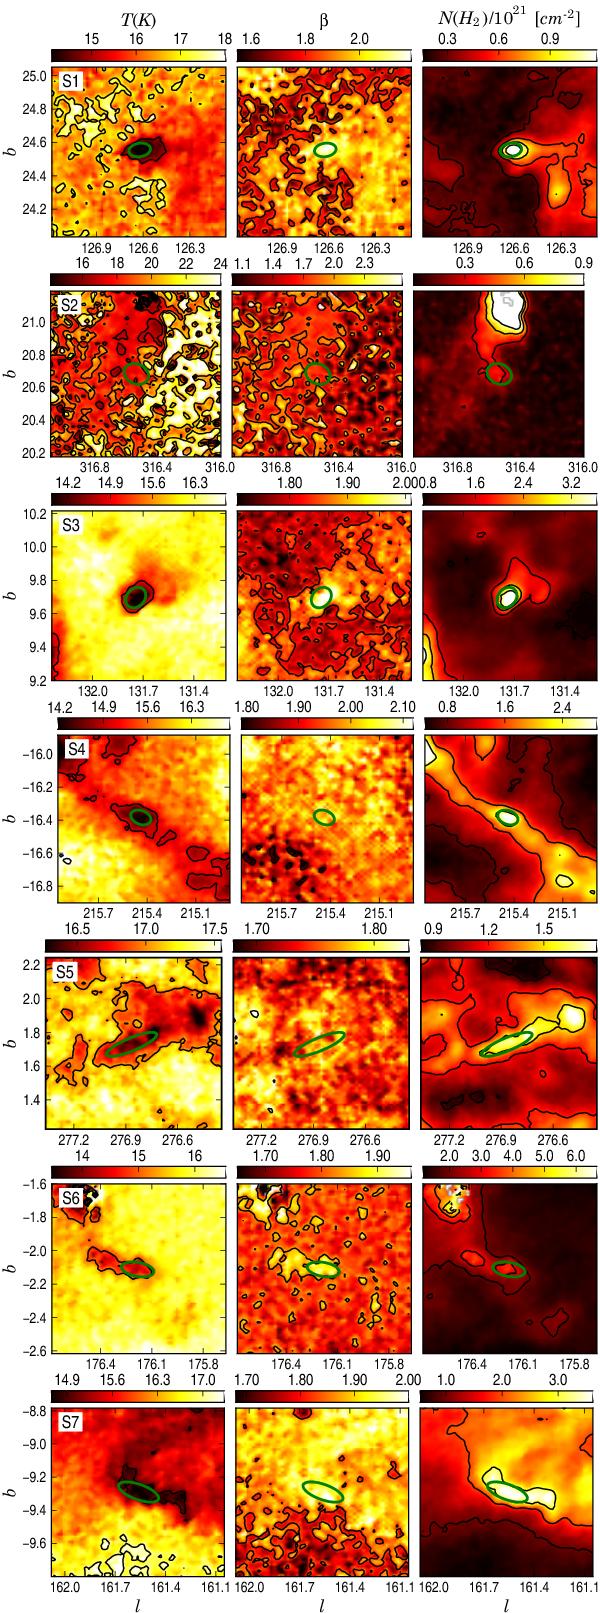
Maps of dust colour temperature, emissivity spectral index and column density for each clump field (the three SDP fields are shown in Juvela et al. (2011) using Herschel maps). The NH2 contours correspond to the ticks on the colour bar. For T and β, the contours are shown respectively at 2K intervals and for β = 1.85. The ellipses trace the FWHMs of the Planck clumps as inferred from the fit (see Table 1).

Current usage metrics show cumulative count of Article Views (full-text article views including HTML views, PDF and ePub downloads, according to the available data) and Abstracts Views on Vision4Press platform.
Data correspond to usage on the plateform after 2015. The current usage metrics is available 48-96 hours after online publication and is updated daily on week days.
Initial download of the metrics may take a while.