| Issue |
A&A
Volume 535, November 2011
|
|
|---|---|---|
| Article Number | L4 | |
| Number of page(s) | 4 | |
| Section | Letters | |
| DOI | https://doi.org/10.1051/0004-6361/201117995 | |
| Published online | 17 November 2011 | |
Letter to the Editor
The discovery of the 401 Hz accreting millisecond pulsar IGR J17498-2921 in a 3.8 h orbit
1 Dipartimento di Fisica, Universitá degli Studi di Cagliari, SP Monserrato-Sestu, KM 0.7, 09042 Monserrato, Italy
2 ISDC Science Data Center for Astrophysics of the University of Geneva, chemin d’Écogia 16, 1290 Versoix, Switzerland
3 INAF – Osservatorio Astronomico di Brera, via E. Bianchi 46, 23807 Merate, Italy
4 Dipartimento di Fisica, Universitá di Palermo, via Archirafi 36, 90123 Palermo, Italy
5 INAF – Osservatorio Astronomico di Cagliari, Poggio dei Pini, Strada 54, 09012 Capoterra, Italy
Received: 1 September 2011
Accepted: 7 November 2011
Abstract
We report on the detection of a 400.99018734(1) Hz coherent signal in the Rossi X-ray Timing Explorer (RXTE) light curves of the recently discovered X-ray transient, IGR J17498 − 2921. By analysing the frequency modulation caused by the orbital motion observed between August 13 and September 8, 2011, we derive an orbital solution for the binary system with a period of 3.8432275(3) h. The measured mass function, f(M2,M1,i) = 0.00203807(8) M⊙, allows to set a lower limit of 0.17 M⊙ on the mass of the companion star, while an upper limit of 0.48 M⊙ is set by imposing that the companion star does not overfill its Roche lobe. We observe a marginally significant evolution of the signal frequency at an average rate of − (6.3 ± 1.9) × 10-14 Hz s-1. The low statistical significance of this measurement and the possible presence of timing noise hampers a firm detection of any evolution of the neutron star spin. We also present an analysis of the spectral properties of IGR J17498 − 2921 based on the observations performed by the Swift-X-ray Telescope and the RXTE-Proportional Counter Array between August 12 and September 22, 2011. During most of the outburst, the spectra are modeled by a power-law with an index Γ ≈ 1.7 − 2, while values of ≈ 3 are observed as the source fades into quiescence.
Key words: stars: neutron / stars: rotation / pulsars: individual: IGR J17498 − 2921 / X-rays: binaries
© ESO, 2011
1. Introduction
The discovery of a 401 Hz coherent signal from the X-ray transient SAX J1808.4-3658 (Wijnands & van der Klis 1998) confirmed that old neutron stars (NS) in low mass X-ray binaries (LMXB) are rapidly rotating objects, spun-up by the accretion of angular momentum from matter in-falling through a disc. Sources showing a coherent signal with a period of few ms are called accreting millisecond pulsars (AMSP); they are all relatively faint X-ray transients attaining peak X-ray luminosities of a few × 1036 erg s-1, with outbursts lasting up to a few months.
Here we report on the discovery of 401 Hz pulsations from the X-ray transient IGR J17498 − 2921, which was first detected on 2011 Aug. 11.9 thanks to an INTEGRAL observation (Gibaud et al. 2011, the epochs in this paper are referred to the barycentric dynamical time, TDB). A subsequent Rossi X-ray Timing Explorer (RXTE) observation allowed the discovery of a coherent signal at 401 Hz (Papitto et al. 2011b), bringing to 12 the number of known AMSPs1. The source position was determined by follow-up Swift (Bozzo et al. 2011) and Chandra (Chakrabarty et al. 2011) observations. The latter estimate,  , Dec = −29°19′19.6′′, with an uncertainty of 0.6′′ at a 90% confidence level, is considered here. Bursts were detected by Ferrigno et al. (2011) during INTEGRAL observations, while Linares et al. (2011a) found oscillations at a frequency consistent with the spin frequency during a burst observed by RXTE, as well as a photospheric radius expansion episode, from which a distance estimate of 7.6 kpc was derived. The transient returned to quiescence on 2011 Sep. 19, after a 37 day-long outburst (Linares et al. 2011b).
The analysis of the RXTE observations performed during the first few days of the outburst allowed Markwardt et al. (2011) to propose a set of candidate orbital solutions, and Papitto et al. (2011a) to give the first preliminary solution of a 3.84 h orbit of the NS. Here we present the first analysis of the IGR J17498 − 2921 observations performed by RXTE and Swift, focusing on the properties of the 401 Hz signal observed by RXTE and deriving a full orbital and timing solution for the pulsar.
2. Observations and data analysis
We processed data obtained by the Swift/X-ray Telescope (XRT; 0.2 − 10 keV, Gehrels et al. 2004) between 2011 Aug. 12.6 and Sep. 22.7 (MJD 55 785.6 − 55 826.7), for an exposure of 48.3 ks, using standard procedures (Burrows et al. 2005) and the latest calibration files available at the time of the analysis (September 2011). We considered observations performed in photon counting mode, retaining the full spectroscopic and imaging capabilities of the XRT with a time resolution of 2.5 s, and windowed timing mode, which preserves only one imaging axis to allow a read out every 1.7 ms. According to the recommendations of the XRT calibration team2, we produced 1 − 10 keV energy spectra grouping channels to contain at least 50 counts each, adding an estimated systematic error of 3% to each bin.
Reduction and analysis of the data obtained by the RXTE/Proportional Counter Array (PCA; 2 − 60 keV; Jahoda et al. 2006) between 2011 Aug. 13.1 to Sep. 22.4 (MJD 55 786.1–55 826.4), for an exposure of 94.2 ks, was carried out with the tools available in HEASOFT (ver. 6.11). Spectra were extracted from data encoded in Standard 2 mode (time resolution of 16 s and 128 spectral channels). We retained only photons collected by the top layer of the proportional counter unit (PCU) 2 in the 2.5–30 keV band, adding a systematic error of 0.5% to each spectral channel, to get the most reliable description of the PCA energy redistribution3. The background was estimated with the “bright” model. A timing analysis was performed on 2–60 keV photons observed by all the PCUs switched on during each of the observations, to achieve the highest possible quality counting statistics. Data processed in fast encoding modes such as event, single bit (both with 122 μs time resolution), and good xenon (1 μs time resolution) are considered.
Since in these paper we deal with the source properties during its persistent (i.e., non-bursting) emission, we discard 5s of data before each of the seven bursts detected by RXTE, as well as before the two observed by Swift, and an interval of variable length depending on the burst properties (~60 s), after.
2.1. Light curves and spectra
The 1–10 keV Swift/XRT spectra are satisfactorily modelled by an absorbed power law. The best-fit value of the absorption column ranges from 2.5 to 3.5 × 1022 cm-2. Since these values are compatible and much less accurate than the Chandra estimate given by Torres et al. (2011), nH = (2.87 ± 0.04) × 1022 cm-2, we fixed the absorption column to this value in the fitting. The 2 − 10 keV absorbed flux is plotted as grey triangles in panel (a) of Fig. 1, together with a dashed line representing the average flux trend obtained by fitting with a sixth-order polynomial also the flux observed by the RXTE/PCA in the same energy band (black circles; see below). We measured an excess of 2.1(2) × 10-10 erg cm-2 s-1 with respect to this trend during the Swift observation starting on 2011 Aug. 20.5, a value significantly larger than the average rms scatter in the flux observed, 3.5 × 10⁻¹¹ erg cm-2 s-1. The flux during this observation of  erg cm-2 s-1, is the peak value observed during the outburst and corresponds to an unabsorbed luminosity of
 erg s-1, where d7.6 is the distance to the source in units of 7.6 kpc. An excess of 1.0(2) × 10-10 erg cm-2 s-1 is also observed during the observation starting on 2011 Aug. 21.5. By comparing these observations with the nearest ones, a timescale as low as ≈ 1000 s is found for the flux variability. Spectral variability is not observed as the photon index, Γ, has values that are consistent with those observed during most of the Swift/XRT observations (between 1.7 and 2; see grey triangles in panel (b) of Fig. 1). A steepening of the power law is instead observed as the transient fades to quiescence. The source was no longer detected after Sep. 19; by co-adding the observations performed from Sep. 19.4 to 22.7, we obtained an upper limit of 3.2 × 10⁻¹³ erg cm-2 s-1 to the 2 − 10 keV flux (3σ c.l., assuming a power-law with index Γ = 1.8).
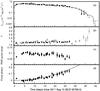 |
Fig. 1 Panel a): absorbed 2–10 keV flux of IGR J17498 − 2921 as observed by the Swift/XRT (grey triangles) and by RXTE/PCA (black circles), and its best-fit sixth-order polynomial relation (dashed line). The PCA fluxes were obtained after subtracting the spectrum observed during the interval 2011 Sep. 20.5–22.4 (days 39.5 and 41.4 in the scale used here), when the source already faded into quiescence; panel b): photon index of the power-law spectra observed by Swift/XRT (grey triangles) and RXTE/PCA (black circles); panel c): rms amplitude of the 401 Hz signal as observed by the PCA; panel d): pulse phases obtained by folding around ν0 = 400.99018734 Hz the PCA time-series corrected for the orbital motion using the parameters listed in Table 1, together with the best-fit quadratic model plotted as a dashed line. |
The X-ray transient IGR J17498 − 2921 lies very close to the central regions of the Galactic bulge (l = 0.1559°, b = −1.0038°) and the emission of the Galactic ridge and numerous nearby sources contaminate the observations in the field of view of the PCA, which is about 1 by 1 degrees with a hexagonal shape. Revnivtsev et al. (2009) estimated a 2–10 keV surface brightness of (8.6 ± 0.5) × 10-11 erg cm-2 s-1 deg-2 from a nearby field not containing bright sources. Moreover, ten sources with 2–12 keV flux exceeding 5 × 10-11 erg cm-2 s-1 were found in a region of 1° around the position of IGR J17498 − 2921 in the fifth XMM-Newton serendipitous source catalogue (Watson et al. 2009); the brightest of these sources is the persistent burster 1A 1742–294 with a 2–10 keV flux between 2 and 4 × 10⁻¹⁰ erg cm-2 s-1. To estimate the contamination of the PCA spectra, we considered observations performed between 2011 Sep. 20.5 and Sep. 22.4, for an exposure of 3.7 ks, when the transient had already faded into quiescence (see above). The net count-rate observed by the top layer of the PCU2 during these observations was 32.5(2) s-1 (36.5(2) s-1, if all the layers are considered) and the absorbed 2 − 10 keV flux is (3.5 ± 0.1) × 10-10 erg cm-2 s-1. We considered the spectrum obtained during these PCA observations as an additional background to those performed previously. After this subtraction, all the PCA spectra could be accurately described by an absorbed power-law, with the value of nH fixed to the Chandra estimate. The 2–10 keV fluxes and the best-fit values of the power-law photon index, ranging from 1.8 to 2, are plotted as black circles in panels (a) and (b) of Fig. 1, respectively. We found that the best-fit models of the simultaneous Swift-XRT and RXTE/PCA spectra are consistent with each other.
The bolometric fluence of the outburst was estimated to be ℱ = (4.1 ± 0.6) × 10-3 erg cm-2 by integrating the average trend of the 2–10 keV source flux (dashed line in panel (a) of Fig. 1) over the whole outburst length, and scaling the value obtained by a bolometric correction factor (cbol = 6.0) equal to the average observed ratio of the unabsorbed flux extrapolated to the 0.05–100 keV band to the absorbed flux observed in the 2–10 keV band. Assuming that ΔM = R ∗ ℱ/GM ∗ , the mass accreted by the NS during the outburst is estimated to be ΔM = (8 ± 1) × 10-11 for a M ∗ = 1.4 M⊙ NS with a radius of R ∗ = 10 km, a value typical of outbursts of AMSPs (Galloway 2006). However, these values can be overestimated by a factor of ~ 2 because of the unknown spectral distribution of the source outside the energy band considered here. Describing the broad-band spectrum with a Comptonization model with input photons and hot scattering electrons with temperatures of 0.5 and 50 keV, respectively, would yield a value of cbol ≃ 3.
2.2. Timing analysis
To perform a timing analysis of the 401 Hz signal, we reported the photon arrival times to the barycentre of the Solar System by using the Chandra position (Chakrabarty et al. 2011) and applied fine clock corrections using the latest calibration file issued by the PCA team at the time of the analysis (September 2011)4, to reach an accuracy in absolute timing of between 5 and 8 μs.
A signal at a frequency of between 400.95 and 401.0 Hz is observed in power spectra produced over 256 s intervals, at a Lehay-normalised power of ≈ 60–70. A first solution of the orbital motion of the NS was obtained by performing an epoch-folding search over 256 s intervals and modelling the variations in the signal period caused by the orbital motion. We thus obtained a first estimate of the orbital parameters of the source, such as the orbital period, Porb = 13835.65(5) s, the projected semi-major axis of the NS orbit, asini/c = 0.3651(2) lt-s, the epoch of zero mean anomaly, T ∗ , and upper limits to esinω and ecosω, where e is the eccentricity and ω is the longitude of the periastron measured from the ascending node, as well as of the barycentric spin frequency, ν0 = 400.99020(2) Hz.
The times of arrival of X-ray photons were then corrected by using this first orbital solution, and the time series folded into 16 phase bins around the best estimate of the spin period, over 1500 s time intervals. The presence and significance of pulsations in the folded light curves were assessed following Leahy et al. (1983). The background-subtracted 2–60 keV RMS amplitude of the observed profiles is plotted in panel (c) of Fig. 1. To take into account the contribution of the the Galactic ridge and of nearby sources to the PCA count rate, we considered an additional background level of 36.5(1) s-1 (determined from PCU2 observations of the field, see Sect. 2.1) for every active PCU. This is only an approximation since the responses and background levels of the various PCUs differ by about 10 per cent, introducing an error in the estimated amplitude that is comparable to the statistical uncertainties in the various measurements. The intrinsic pulse RMS amplitude thus evaluated takes values ranging from 0.06 to 0.11, with relative uncertainties of the order of 10–15 per cent. The pulse profiles can generally be modelled by a sinusoid. A second harmonic with an rms amplitude between 1 and 2 per cent, and a relative uncertainty of ≈ 25 per cent, is detected only during the brightest observations. Pulsations are not detected during the observations performed on 2011 Sep. 14 and 15 (MJD 55 818–55 819), with an upper limit of about 20 per cent to the pulsed fraction, reflecting our approximate knowledge of the true background level, especially when the source flux is low.
Spin and orbital parameters of IGR J17498 − 2921.
The estimates of the spin and orbital parameters of the pulsar were refined by applying timing techniques to the pulse phase delays (Deeter et al. 1981), i.e., modelling their evolution as +\frac{1}{2}\langle\dot{\nu}\rangle(t-\bar{T})^2+R_{\rm orb}(t), \end{equation}](/articles/aa/full_html/2011/11/aa17995-11/aa17995-11-eq75.png) (1)where
(1)where  is the reference epoch of the folding, νF is the folding frequency,
  is the average curvature of the trend followed by the phases, equal to the average spin frequency derivative under the assumption that the spin is well-tracked by the pulse phases, and Rorb(t) describes a phase modulation caused by the slight differences between the actual orbital parameters of the system and those used to correct the time series, i.e., Porb, asini/c, T ∗ , esinω, and ecosω. The best-fit parameters that we found are listed in Table 1, while the pulse phases obtained by folding the RXTE light curves around ν0 = 400.99018734 Hz are plotted in panel (d) of Fig. 1, together with the best-fit model. The modeling of the pulse phase delays of IGR J17498 − 2921 with Eq. (1) is satisfactory since χ2/d.o.f. = 76/50 ≃ 1.5. We measured a statistically significant curvature of the phase evolution
  Hz s-1, which is also indicated by the improvement in the chi-squared of the model obtained by adding the quadratic term to a linear model, Δχ2 = −47. The interpretation of this curvature in terms of a spin frequency derivative should indeed be taken with caution. If the phases relative to the first RXTE observation (spanning 2011 Aug. 14.124–14.145; MJD 55 786.124–55 786.145) were removed from the fit, the estimate of
  would become much less significant, ( − 3.9 ± 1.0) × 10-14 Hz s-1. Moreover, the uncertainty in the source position introduces a systematic error of the same order to this estimate. By considering the uncertainty in the position given by Chakrabarty et al. (2011) thanks to an observation perfomed by the HRC-S detector on-board Chandra (0.6′′ at 90% confidence level, which corresponds to 0.4′′ at 1σ c.l. according to the distribution of aspect offset of the detector5), we derived a systematic error in the estimates of the spin frequency and of its derivative equal to 8 × 10⁻⁸ Hz and 1.5 × 10⁻¹⁴ Hz s-1, respectively (Lyne & Graham-Smith 1990). Adding in quadrature this error to the statistical uncertainty in , we found that the detection of a frequency derivative is only marginally significant. The modulus of the value obtained by fitting the whole data-set,
  Hz s-1, is 3.3 times larger than its overall uncertainty, while the estimate obtained by removing the first RXTE observation from the sample becomes compatible with zero within the error.
3. Discussion and conclusions
We have presented an analysis of the observations performed by RXTE and Swift during the outburst shown between August and September 2011 by the newly discovered AMSP IGR J17498−2921. We have reported the discovery of a coherent signal at a frequency of 401 Hz in the RXTE light curves, as well as derived an accurate orbital solution for the 3.84 h binary system.
The pulse profile shown by IGR J17498−2921 is modelled by a sinusoid with an rms amplitude between 6 and 11 per cent. A second harmonic with an amplitude about ten times lower is detected only in a subset of observations. Nearly sinusoidal profiles, with a similar ratio of the second to the first harmonic amplitudes, had already been observed from XTE J1751−305 (Markwardt et al. 2002) and IGR J00291+5934 (Galloway et al. 2005; Falanga et al. 2005). The pulse phases shown by IGR J17498−2921 are quite stable and their evolution can be closely described by a polynomial of low (≤2) order, in addition to the delays introduced by the orbital motion. Interestingly, this property is shared by IGR J17498−2921 with XTE J1751−305 (Papitto et al. 2008) and IGR J00291+5934 (Falanga et al. 2005; Burderi et al. 2007; Patruno 2010; Hartman et al. 2011; Papitto et al. 2011c), while the phases of other AMSPs are instead affected by timing noise (see, e.g., Hartman et al. 2008; Riggio et al. 2008). We note how the phases of IGR J17498−2921 are affected by an error of ≈0.01, a value consistent with the phase uncertainty of a noisy pulsar such as SAX J1808.4-3658 (see Table 2 of Hartman et al. 2008), such that the enhanced phase stability observed in this case does not seem to be caused (at least entirely) by a lower quality pulse statistics. The evolution of the pulse phases of IGR J17498−2921 is best-fitted by a parabola with positive curvature, indicating a NS spin-down at a rate of (−6.3 ± 1.9) × 10-14 Hz s-1 if interpreted in terms of the NS spin frequency derivative. A similar trend was already observed from other two AMSPs (Galloway et al. 2002; Papitto et al. 2007), but the low significance of this measurement and the possible presence of residual timing noise prevents us from drawing a firm detection of a NS spin evolution.
The value of the pulsar mass function f(M2,M1,i) ≃ 2 × 10⁻³ M⊙ allows us to set constraints on the nature of the companion star. Since no eclipses are observed during RXTE/PCA and Swift/XRT observations performed when the NS is behind the companion (i.e., at true orbital longitudes ~90°), we have inferred that the inclination of the system is less than 80°. This provides a lower limit to the companion mass of m2 ≳ 0.066 + 0.077m1, where m1 and m2 are the masses of the two stars in solar masses (m2 ≳ 0.17 for m1 = 1.4). An upper limit to the companion mass is obtained by assuming that it does not overfill its Roche lobe, the size of which is estimated by the relation of Paczyński (1971), RL2 = 0.462a [m2/(m1 + m2)] 1/3, where a is the binary separation. By using the third Kepler law to relate the size of the orbit to both the total mass of the system and the observed orbital period, one obtains  . This relation is plotted in Fig. 2 together with the zero age main sequence (ZAMS) mass-radius relation given by Chabrier & Baraffe (2000). By assuming that the companion star fills its Roche Lobe and follows the ZAMS mass-radius relation, we derived values of m2 = 0.48 and i = 24.6° for the companion star mass and the system inclination, respectively. While heavier companion stars can be excluded, lower values are possible if the companion is bloated with respect to its thermal equilibrium radius. If a NS with a mass of 2 M⊙ is considered, the lower limit to the system inclination set under these assumptions increases to 28.8°. Among the scenarios explaining the evolution of LMXBs (see Deloye 2008, for a review), the orbital period of IGR J17498 − 2921 and the limits to the mass of the companion derived here are consistent with a cataclysmic variable-like evolutionary path, where the low-mass donor made contact with its Roche lobe before evolving to the red giant branch (see, e.g., the sequences plotted in Fig. 2 of Podsiadlowski et al. 2002).
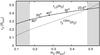 |
Fig. 2 Size of the Roche lobe of the donor of IGR J17498−2921 (solid curve) and ZAMS mass-radius relation given by Chabrier & Baraffe (2000, dotted line). The masses and radii of donor stars filling their Roche lobe, calculated from the measured mass function assuming m1 = 1.4 and a set of values of inclination, are indicated as black points. The left shaded region is excluded by the observed mass function and by the absence of eclipses (see text), while the right one is excluded by the condition that the companion star does not overfill its Roche lobe. |
The properties of the intermittent pulsars, Aql X-1 (Casella et al. 2008) and SAX J1748.9–2021 (Altamirano et al. 2008), seem distinct enough not to count them in this number.
Acknowledgments
This work is supported by the Italian Space Agency, ASI-INAF I/088/06/0 and I/009/10/0 contracts for High Energy Astrophysics, and by the operating program of Regione Sardegna (ESF 2007-2013), L.R.7/2007, “Promoting scientific research and technological innovation in Sardinia”. We thank the Swift team for the very rapid scheduling of the observations.
References
- Altamirano, D., Casella, P., Patruno, A., et al. 2008, ApJ, 674, L45 [NASA ADS] [CrossRef] [Google Scholar]
- Bozzo, E., Beardmore, A., Papitto, A., et al. 2011, ATel, 3558, 1 [NASA ADS] [Google Scholar]
- Burderi, L., Di Salvo, T., Lavagetto, G., et al. 2007, ApJ, 657, 961 [NASA ADS] [CrossRef] [Google Scholar]
- Burrows, D. N., Hill, J. E., Nousek, J. A., et al. 2005, Space Sci. Rev., 120, 165 [NASA ADS] [CrossRef] [Google Scholar]
- Casella, P., Altamirano, D., Patruno, A., et al. 2008, ApJ, 674, L41 [NASA ADS] [CrossRef] [Google Scholar]
- Chabrier, G., & Baraffe, I. 2000, ARA&A, 38, 337 [NASA ADS] [CrossRef] [Google Scholar]
- Chakrabarty, D., Markwardt, C. B., Linares, M., et al. 2011, ATel, 3606, 1 [NASA ADS] [Google Scholar]
- Deeter, J. E., Boynton, P. E., & Pravdo, S. H. 1981, ApJ, 247, 1003 [NASA ADS] [CrossRef] [Google Scholar]
- Deloye, C. J. 2008, in 40 Years of Pulsars: Millisecond Pulsars, Magnetars and More, ed. C. Bassa, Z. Wang, A. Cumming, & V. M. Kaspi, AIP Conf. Ser., 983, 501 [Google Scholar]
- Falanga, M., Kuiper, L., Poutanen, J., et al. 2005, A&A, 444, 15 [NASA ADS] [CrossRef] [EDP Sciences] [Google Scholar]
- Ferrigno, C., Bozzo, E., Gibaud, L., et al. 2011, ATel, 3560, 1 [NASA ADS] [Google Scholar]
- Galloway, D. K. 2006, in The Transient Milky Way: A Perspective for MIRAX, ed. F. D’Amico, J. Braga, & R. E. Rothschild, AIP Conf. Ser., 840, 50 [Google Scholar]
- Galloway, D. K., Chakrabarty, D., Morgan, E. H., et al. 2002, ApJ, 576, L137 [NASA ADS] [CrossRef] [Google Scholar]
- Galloway, D. K., Markwardt, C. B., Morgan, E. H., et al. 2005, ApJ, 622, L45 [NASA ADS] [CrossRef] [Google Scholar]
- Gehrels, N., Chincarini, G., Giommi, P., et al. 2004, ApJ, 611, 1005 [NASA ADS] [CrossRef] [Google Scholar]
- Gibaud, L., Bazzano, A., Bozzo, E., et al. 2011, ATel, 3551, 1 [NASA ADS] [Google Scholar]
- Hartman, J. M., Patruno, A., Chakrabarty, D., et al. 2008, ApJ, 675, 1468 [NASA ADS] [CrossRef] [Google Scholar]
- Hartman, J. M., Galloway, D. K., & Chakrabarty, D. 2011, ApJ, 726, 26 [NASA ADS] [CrossRef] [Google Scholar]
- Jahoda, K., Markwardt, C. B., Radeva, Y., et al. 2006, ApJS, 163, 401 [NASA ADS] [CrossRef] [Google Scholar]
- Leahy, D. A., Darbro, W., Elsner, R. F., et al. 1983, ApJ, 266, 160 [NASA ADS] [CrossRef] [Google Scholar]
- Linares, M., Altamirano, D., Watts, A., et al. 2011a, ATel, 3568, 1 [NASA ADS] [Google Scholar]
- Linares, M., Bozzo, E., Altamirano, D., et al. 2011b, ATel, 3661, 1 [NASA ADS] [Google Scholar]
- Lyne, A. G., & Graham-Smith, F. 1990, Pulsar astronomy (Cambridge: Cambridge University Press) [Google Scholar]
- Markwardt, C. B., Swank, J. H., Strohmayer, T. E., et al. 2002, ApJ, 575, L21 [Google Scholar]
- Markwardt, C. B., Strohmayer, T. E., & Smith, E. A. 2011, ATel, 3561, 1 [NASA ADS] [Google Scholar]
- Paczyński, B. 1971, ARA&A, 9, 183 [NASA ADS] [CrossRef] [Google Scholar]
- Papitto, A., Di Salvo, T., Burderi, L., et al. 2007, MNRAS, 375, 971 [NASA ADS] [CrossRef] [Google Scholar]
- Papitto, A., Menna, M. T., Burderi, L., et al. 2008, MNRAS, 383, 411 [NASA ADS] [CrossRef] [Google Scholar]
- Papitto, A., Belloni, T. M., Ferrigno, C., et al. 2011a, ATel, 3563, 1 [NASA ADS] [Google Scholar]
- Papitto, A., Ferrigno, C., Bozzo, E., et al. 2011b, ATel, 3556, 1 [NASA ADS] [Google Scholar]
- Papitto, A., Riggio, A., Burderi, L., et al. 2011c, A&A, 528, A55 [NASA ADS] [CrossRef] [EDP Sciences] [Google Scholar]
- Patruno, A. 2010, ApJ, 722, 909 [NASA ADS] [CrossRef] [Google Scholar]
- Podsiadlowski, P., Rappaport, S., & Pfahl, E. D. 2002, ApJ, 565, 1107 [NASA ADS] [CrossRef] [Google Scholar]
- Revnivtsev, M., Sazonov, S., Churazov, E., et al. 2009, Nature, 458, 1142 [NASA ADS] [CrossRef] [PubMed] [Google Scholar]
- Riggio, A., Di Salvo, T., Burderi, L., et al. 2008, ApJ, 678, 1273 [NASA ADS] [CrossRef] [Google Scholar]
- Torres, M. A. P., Madej, O., Jonker, P. G., et al. 2011, ATel, 3638, 1 [NASA ADS] [Google Scholar]
- Watson, M. G., Schröder, A. C., Fyfe, D., et al. 2009, A&A, 493, 339 [NASA ADS] [CrossRef] [EDP Sciences] [Google Scholar]
- Wijnands, R., & van der Klis, M. 1998, Nature, 394, 344 [NASA ADS] [CrossRef] [Google Scholar]
All Tables
All Figures
|
Fig. 1 Panel a): absorbed 2–10 keV flux of IGR J17498 − 2921 as observed by the Swift/XRT (grey triangles) and by RXTE/PCA (black circles), and its best-fit sixth-order polynomial relation (dashed line). The PCA fluxes were obtained after subtracting the spectrum observed during the interval 2011 Sep. 20.5–22.4 (days 39.5 and 41.4 in the scale used here), when the source already faded into quiescence; panel b): photon index of the power-law spectra observed by Swift/XRT (grey triangles) and RXTE/PCA (black circles); panel c): rms amplitude of the 401 Hz signal as observed by the PCA; panel d): pulse phases obtained by folding around ν0 = 400.99018734 Hz the PCA time-series corrected for the orbital motion using the parameters listed in Table 1, together with the best-fit quadratic model plotted as a dashed line. |
| In the text | |
|
Fig. 2 Size of the Roche lobe of the donor of IGR J17498−2921 (solid curve) and ZAMS mass-radius relation given by Chabrier & Baraffe (2000, dotted line). The masses and radii of donor stars filling their Roche lobe, calculated from the measured mass function assuming m1 = 1.4 and a set of values of inclination, are indicated as black points. The left shaded region is excluded by the observed mass function and by the absence of eclipses (see text), while the right one is excluded by the condition that the companion star does not overfill its Roche lobe. |
| In the text | |
Current usage metrics show cumulative count of Article Views (full-text article views including HTML views, PDF and ePub downloads, according to the available data) and Abstracts Views on Vision4Press platform.
Data correspond to usage on the plateform after 2015. The current usage metrics is available 48-96 hours after online publication and is updated daily on week days.
Initial download of the metrics may take a while.