Fig. 1
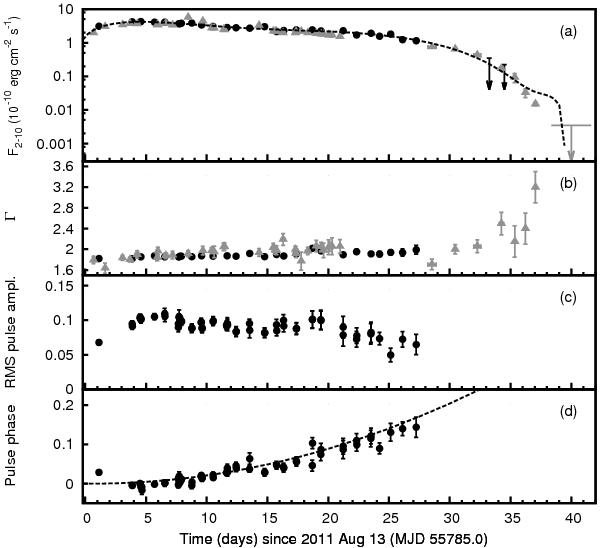
Panel a): absorbed 2–10 keV flux of IGR J17498 − 2921 as observed by the Swift/XRT (grey triangles) and by RXTE/PCA (black circles), and its best-fit sixth-order polynomial relation (dashed line). The PCA fluxes were obtained after subtracting the spectrum observed during the interval 2011 Sep. 20.5–22.4 (days 39.5 and 41.4 in the scale used here), when the source already faded into quiescence; panel b): photon index of the power-law spectra observed by Swift/XRT (grey triangles) and RXTE/PCA (black circles); panel c): rms amplitude of the 401 Hz signal as observed by the PCA; panel d): pulse phases obtained by folding around ν0 = 400.99018734 Hz the PCA time-series corrected for the orbital motion using the parameters listed in Table 1, together with the best-fit quadratic model plotted as a dashed line.
Current usage metrics show cumulative count of Article Views (full-text article views including HTML views, PDF and ePub downloads, according to the available data) and Abstracts Views on Vision4Press platform.
Data correspond to usage on the plateform after 2015. The current usage metrics is available 48-96 hours after online publication and is updated daily on week days.
Initial download of the metrics may take a while.