| Issue |
A&A
Volume 534, October 2011
|
|
|---|---|---|
| Article Number | L15 | |
| Number of page(s) | 4 | |
| Section | Letters | |
| DOI | https://doi.org/10.1051/0004-6361/201117778 | |
| Published online | 18 October 2011 | |
Letter to the Editor
A study of the color diversity around maximum light in Type Ia supernovae
1
Departamento de AstronomíaUniversidad de Chile,
Casilla 36-D,
Santiago,
Chile
2
Department of Astronomy, Yale University,
New Haven, CT
06520,
USA
3
Institute for the Physics and Mathematics of the Universe (IPMU),
University of Tokyo, 5-1-5
Kashiwanoha, Kashiwa, Chiba
277-8583,
Japan
4
Departamento Ciencias Físicas, Universidad Andres
Bello, Av. República
252, Santiago,
Chile
Received:
28
July
2011
Accepted:
2
October
2011
Abstract
From a sample of 12 well-observed Type Ia supernovae, we find clear evidence of correlations between early phase (U − B), (V − R), and (V − I) colors and the velocity shifts of the [Fe II] λ7155 and [Ni II] λ7378 nebular lines measured from late-phase spectra. As these lines are thought to trace the ashes of the initial deflagration process, our findings provide additional support to the new paradigm of off-center explosions in Type Ia supernovae, and we interpret these correlations as viewing angle effects in the observed colors. We also show that the nebular velocity shifts are related to the strength and width of the Ca II and IR-triplet lines near-maximum light. The evidence presented here implies that the viewing angle must be taken into account when deriving extinction values and distances in future cosmological studies based on Type Ia supernovae.
Key words: distance scale / supernovae: general
© ESO, 2011
1. Introduction
Type Ia Supernovae (SNe) play an important role in modern astrophysics thanks to their great power in extragalactic distance determinations, which permitted the discovery of the cosmic acceleration (Riess et al. 1998; Perlmutter et al. 1999). Line-of-sight extinction has to be taken into account to correct the distance estimate of the SN host galaxy. Several empirical methods that make use of SN colors have been developed for this purpose and very different extinction laws from the Galactic law need to be invoked to reduce the dispersion in the calibration of SNe Ia in cosmological studies (Hicken et al. 2009; Folatelli et al. 2010; Wang et al. 2009b).
Theoretical and observational studies have shown evidence of an off-center deflagration as the initial burning process in SNe Ia (Kasen et al. 2009; Maeda et al. 2010c,a, 2011). Maeda et al. (2010a) show a relation between the velocity gradient of the Si II lines observed near maximum light and the nebular velocity shifts measured from the [Fe II] λ7155 and [Ni II] λ7378 lines, which are thought to trace the region where the initial deflagration occurs. The off-center explosion model of Maeda et al. (2010a) explains the large diversity in velocity gradients near maximum light described in Benetti et al. (2005), who classifies as either high velocity gradient (HVG) or low velocity gradient (LVG) SNe depending on the velocity gradient of the Si II λ6355 line.
Kasen et al. (2009), Maeda et al. (2011), and Foley & Kasen (2011) demonstrate both theoretically and observationally that the (B − V) colors and luminosity depend on the asymmetry of the explosion and the viewing angle. Here we present additional evidence that favors this new paradigm of asymmetric explosions in the form of strong correlations of (V − I), (V − R), and (U − B) colors at very early phases with the nebular velocity shifts at late epochs. These correlations could be useful in improving SN color calibrations in future cosmological studies.
2. Sample and methodology
Our sample consists of 12 nearby SNe with a well-sampled light curve, photometry from at least six days before maximum light and late-time spectroscopic observations, i.e. at least 150 days after maximum, to measure nebular velocity shifts. In Table 1, we summarize the decline rate ( ) and line-of-sight reddening values of our Type Ia SNe sample.
Sample of Type Ia supernovae.
We estimated the epoch of maximum light for each filter, , and the SN colors at different epochs using fifth order polynomial interpolated light curves. We used K-corrected photometry for SN 2004eo and S-corrected photometry whenever available in the literature. Given that we are interested in assessing the relations between optical colors and nebular velocity shifts around maximum light, we estimated host galaxy reddening using the Lira relation (Phillips et al. 1999), which is a method independent of SN colors at maximum. To estimate Galactic extinction, we used the maps of Schlegel et al. (1998) and the extinction law (RV = 3.1) of Cardelli et al. (1989), which is also used for host galaxy reddening. The reddening estimates are shown in Table 1 and the corresponding reddening-corrected light curves are shown in Fig. 1. We adopted the nebular velocity shifts (Vneb) from Maeda et al. (2011) and studied their relation with SN colors at different epochs.
Finally, we investigate the effect of Ca II lines, which are the dominant features in the U and I bands, in the colors of SNe Ia. To quantify the effects of Ca II in the SN colors, we model the available spectra acquired four days priot to maximum using the code syn++ described in Thomas et al. (2011), and then we computed synthetic photometry for our models with and without Ca II lines.
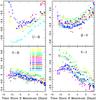 |
Fig. 1 Reddening-corrected colors of our sample of Type Ia supernovae. |
3. Optical colors and the nebular velocity shifts
We now study the relation between optical colors and viewing angle in the context of off-center ignition models (Kasen et al. 2009; Maeda et al. 2010c,b,a). We assume that the viewing angle is traced by the nebular velocity shift of the [Fe II] λ7155 and [Ni II] λ7378 lines, which are suggested to originate from the ashes of the deflagration process (Maeda et al. 2010c,a, 2011).
We first note that in Fig. 1 the (U − B) and (V − I) colors show a large diversity before and near maximum light. The (B − V) and (V − R) color curves, on the other hand, are more homogeneous at all epochs. We show that some of this diversity in colors could be due to the viewing angle.
We now introduce zero subscripts for the reddening-corrected colors. To quantify possible correlations between unreddened colors and Vneb, we use the linear model:  (1)In Fig. 2, we present the evolution of the (U − B)0 and (V − I)0 colors as a function of Vneb, at −4 and 0 days since maximum light, as well as the best-fitting linear model from Eq. (1). From the top and bottom panels, it is clear that there is a linear correlation between (U − B)0 and Vneb and a linear anticorrelation between (V − I)0 and Vneb. Although not shown here, these correlations are clearly present from −8 to +8 days since maximum light, going generally from steeper to shallower slopes with time, in agreement with the scatter seen in Fig. 1. A weaker, but significant anticorrelation was found between (V − R)0 and Vneb, and no significant correlation was found between (B − V)0 and Vneb. Best-fitting parameters for Eq. (1) at selected colors and epochs are shown in Table 2. All the correlations found are significant, with a very low probability of the data being drawn from an uncorrelated population in all cases.
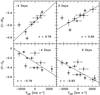 |
Fig. 2 (top) (U − B)0 vs. Vneb at two different epochs. r is the linear correlation coeficient. (bottom) same as above but for (V − I)0. |
Correlations between unreddened colors and Vneb.
4. Effect of viewing angle in Ca II lines
Given that the Ca II H&K and IR-triplet are the strongest lines in the U and I filters, respectively, it is pertinent to investigate whether or not the strength of these features could be responsible for the (U − B)0 and (V − I)0 variations and their dependences on Vneb, presented above. For this purpose, we use the [Fe II] λ7155 and [Ni II] λ7378 line velocity shifts as a proxy for viewing angle.
Figure 3 shows the optical spectra of our sample of Type Ia SNe about four days before maximum, organized as a function of Vneb. The spectra in Fig. 3 are corrected for extinction using the Cardelli et al. (1989) Galactic extinction law (RV = 3.1) and the reddening estimates given in Table 1, shifted to z = 0.
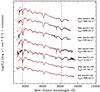 |
Fig. 3 Spectral evolution at −4 days since maximum as a function of nebular velocity shift (Vneb). The observed spectra in black and syn++ models in red (dot-dashed lines). The spectra are redshift and extinction corrected (RV = 3.1). The dashed lines correspond to the expected rest-frame wavelength of and IR-triplet Ca II lines and the spectra in the figure correspond to SN 1994D (Patat et al. 1996), SN 2002bo (Benetti et al. 2004), SN 2002dj (Pignata et al. 2008), SN 2002er (Kotak et al. 2005), SN 2003du (Sollerman et al. 2004), SN 2004eo (Pastorello et al. 2007), SN 2005cf (Bufano et al. 2009). |
A clear trend in the width and strength of the Ca II H&K and IR-triplet lines with nebular velocity shift is evident in Fig. 3. For negative values of the nebular velocity shift, (i.e. seen from the side closer to the deflagration center in the Maeda et al. 2010a model), the Ca II lines are weaker, whereas these features become stronger with increasing values for the nebular velocity shift, (i.e. seen from the opposite side of the initial deflagration in the Maeda et al. 2010a model).
At first glance, it seems that the strength of the Ca II H&K and IR-triplet could explain, at least in part, the color variations with Vneb. For example, as Vneb increases and the Ca II H&K line gets stronger, the U-band flux gets relatively weaker, making the SN look redder in (U − B)0, in qualitative agreement with the trend seen in the top-left panel of Fig. 2. Likewise, as Vneb increases and the Ca II triplet gets stronger, the I-band flux gets relatively weaker, making the SN look bluer in (V − I)0, in qualitative agreement with the trend seen in the bottom-left panel of Fig. 2.
To assess quantitatively the effect of Ca II lines in the colors of SNe Ia, we model the spectra from Fig. 3 using syn++ (Thomas et al. 2011). In syn++, one computes a spectrum by specifying the location and optical depth for a given set of ions. The input parameters for syn++ are the photospheric velocity, the optical depth, the e-folding length of the opacity profile, the maximum and minimum cut-off velocity for each ion, and the Boltzmann excitation temperature for parameterizing line strengths. The spectral models are very good over all wavelengths except blueward of 3800 Å, where the spectrum is dominated by a superposition of many metal lines.
From the resulting model spectra, we compute synthetic colors using the UBVRI filter functions given by Bessell (1990). We then repeat the calculation after removing the Ca lines from the model spectra. Figure 4 shows the total effect of the Ca II lines in the (U − B)0 and (V − I)0 colors, as a function of Vneb. We note that this is the maximum possible effect because we then suppress all of the lines in the spectra. In (U − B)0, the synthetic colors vary by ~0.3 mag, which could account for part of the observed variation of ~0.4 mag shown in Fig. 2. We do not see the regular trend with Vneb expected if Ca lines alone were responsible for the correlations found in this work (Eq. (1)). However given the difficulties in modeling the spectra shortward of 3800 Å it is difficult to separate the contribution of Ca II lines in the colors. In (V − I)0, we recover the trend seen in Fig. 2, although the overall variation in the synthetic colors is a factor of four smaller than the observed variation of ~0.4 mag. We conclude that the strength of the Ca II lines is only partially responsible for the observed variations in colors with Vneb, and part of the color diversity is likely due to differences in the slope of the continuum.
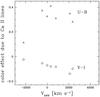 |
Fig. 4 (U − B)0 and (V − I)0 color differences from models of the spectra shown in Fig. 3, and the same spectra after removing the and IR-triplet Ca II lines. |
As expected, our synthetic (B − V)0 and (V − R)0 colors are weakly affected by the Ca II lines, which fall at the edge of the B and R bands. In (B − V)0, the color becomes slightly (~0.05) bluer as Vneb increases from −2000 to 2000 km s-1, which is caused by the emission component of the Ca II H&K P-Cygni profile. In (V − R)0, the effect amounts to only 0.01 mag over the entire range of Vneb.
From our syn++ models, we also find that to properly model the Ca II IR-triplet of the LVG SNe in Fig. 3 it is necessary to add a detached high velocity Ca II component. In the case of the HVG SNe (i.e. SN 2002er, SN 2002bo, and SN 2002dj), using high optical depths and e-folding lengths with a single Ca II component can result in good line models. As noted in Foley & Kasen (2011), as the ejecta velocity increases, the width in velocity space of the line-forming region increases and the lines become broader. Therefore, in HVG SNe individual lines overlap and can be modeled with a single broad Ca II component.
5. Discussion and conclusions
The theoretical work of Kasen et al. (2009) has put forward the notion of intrinsically asymmetric ignition and subsequent detonation in Type Ia SNe, to explain the “peak luminosity-decline rate relation” and color diversities for a given decline rate. Strong support for this idea was provided by Maeda et al. (2010a) by successfully relating the early Type Ia velocity gradient diversity described in Benetti et al. (2005) with the late-time nebular velocity shifts of the [Fe II] λ7155 and [Ni II] λ7378 lines, interpreting the nebular velocity shifts as an indication of viewing angle for an initially off-center deflagration.
We have presented clear evidence of correlations between the late-time nebular velocity shifts, or viewing angle, and the (U − B)0, (V − R)0 and (V − I)0 reddening-corrected colors from −8 to +8 days since B-band maximum, providing additional support to the new paradigm of off-center explosions. In (B − V)0, on the other hand, we find no significant correlation with the nebular velocity shifts. The strengths of these color dependences on Vneb imply that the ejecta are asymmetric and that they are as important as the relations between color and .
We also note that the (Bmax − Vmax) color dependence on velocity gradient found in Foley & Kasen (2011) from a sample of 121 SNe Ia (Wang et al. 2009b) could not be investigated in our sample because of the small number of SNe. On the other hand, the correlation between extinction and corrected (B − V) colors and Vneb found in Maeda et al. (2011) using the relations by Folatelli et al. (2010) are recovered in our sample. Our estimate of the host galaxy extinction is systematically higher by 0.08 mag than the values given in Maeda et al. (2011). These differences are possibly caused by our use of the Lira relation, which is based on the late-time (B − V) colors, while they employ the (Bmax − Vmax) pseudo color at maximum (Folatelli et al. 2010). We do not find any relation between the residuals of our (Bmax − Vmax) colors or extinction estimates and the Maeda et al. (2011) estimates with or Vneb.
The reader may wonder whether our results are an artifact of our method for inferring extinction corrections. This concern can be ruled out given that the (U − B)0 vs. Vneb and (V − I)0 vs. Vneb correlations go in opposite directions, so that it is impossible to wash out both relations simultaneously by changing the reddening technique.
We also show that there is a relation between Vneb and the shape and strength of the Ca II H&K and IR triplet lines, which are the strongest features in the U and I bands, independently of . This agrees with Tanaka et al. (2008), who noted that HVG SNe tend to have stronger Ca II features. As shown in the previous section, the effect of the Ca II lines in (U − B)0 and (V − I)0 is significant, but their strength is only partially responsible for the observed color variations and their dependence on Vneb is difficult to assess. A reasonable conclusion is that the continuum emission is also affected by viewing angle effects.
Finally, the evidence presented here implies that both Vneb and must be taken into account when deriving extinction values based on maximum-light colors, which is a critical parameter in deriving distances from SNe Ia. Furthermore, as shown by Foley & Kasen (2011), ignoring this effect could introduce significant biases in the determination of extinction laws (RV). A larger sample of nearby SNe Ia is urgently required to improve our calibration of these correlations and understand the influence of viewing angle on SN colors.
Acknowledgments
We would like to thank the anonymous referee for constructive comments on the text. R.C. acknowledges support by CONICYT through Programa Nacional de Becas de Postgrado grant D-2108082 and by the Yale-Chile fellowship in astrophysics. R.C., M.H., F.F., and G.P. acknowledges support provided by the Millennium Center for Supernova Science through grant P10-064-F (funded by “Programa Bicentenario de Ciencia y Tecnología de CONICYT” and “Programa Iniciativa Científica Milenio de MIDEPLAN”). M.H. acknowledges support provided by FONDECYT through grant 1060808. M.H. and G.P. acknowledges support provided by Centro de Astrofísica FONDAP 15010003, and Center of Excellence in Astrophysics and Associated Technologies (PFB 06). F.F. acknowledges support provided by FONDECYT through grant 3110042. The work by K.M. is supported by World Premier International Research Center Initiative (WPI Initiative), MEXT, Japan, and by JSPS grant in aid for Scientific Reasearh (23740141). G.P. acknowledges support by the Proyecto FONDECYT 11090421 and from Comité Mixto ESO-Gobierno de Chile.
References
- Benetti, S., Meikle, P., Stehle, M., et al. 2004, MNRAS, 348, 261 [NASA ADS] [CrossRef] [Google Scholar]
- Benetti, S., Cappellaro, E., Mazzali, P. A., et al. 2005, ApJ, 623, 1011 [NASA ADS] [CrossRef] [Google Scholar]
- Bessell, M. S. 1990, PASP, 102, 1181 [NASA ADS] [CrossRef] [Google Scholar]
- Bufano, F., Immler, S., Turatto, M., et al. 2009, ApJ, 700, 1456 [NASA ADS] [CrossRef] [Google Scholar]
- Cardelli, J. A., Clayton, G. C., & Mathis, J. S. 1989, ApJ, 345, 245 [NASA ADS] [CrossRef] [Google Scholar]
- Folatelli, G., Phillips, M. M., Burns, C. R., et al. 2010, AJ, 139, 120 [NASA ADS] [CrossRef] [Google Scholar]
- Foley, R. J., & Kasen, D. 2011, ApJ, 729, 55 [NASA ADS] [CrossRef] [Google Scholar]
- Hicken, M., Challis, P., Jha, S., et al. 2009, ApJ, 700, 331 [NASA ADS] [CrossRef] [Google Scholar]
- Jha, S., Garnavich, P. M., Kirshner, R. P., et al. 1999, ApJS, 125, 73 [NASA ADS] [CrossRef] [Google Scholar]
- Kasen, D., Röpke, F. K., & Woosley, S. E. 2009, Nature, 460, 869 [NASA ADS] [CrossRef] [Google Scholar]
- Kotak, R., Meikle, W. P. S., Pignata, G., et al. 2005, A&A, 436, 1021 [NASA ADS] [CrossRef] [EDP Sciences] [Google Scholar]
- Krisciunas, K., Suntzeff, N. B., Candia, P., et al. 2003, AJ, 125, 166 [NASA ADS] [CrossRef] [Google Scholar]
- Lira, P., Suntzeff, N. B., Phillips, M. M., et al. 1998, AJ, 115, 234 [NASA ADS] [CrossRef] [Google Scholar]
- Maeda, K., Benetti, S., Stritzinger, M., et al. 2010a, Nature, 466, 82 [NASA ADS] [CrossRef] [PubMed] [Google Scholar]
- Maeda, K., Röpke, F. K., Fink, M., et al. 2010b, ApJ, 712, 624 [NASA ADS] [CrossRef] [Google Scholar]
- Maeda, K., Taubenberger, S., Sollerman, J., et al. 2010c, ApJ, 708, 1703 [NASA ADS] [CrossRef] [Google Scholar]
- Maeda, K., Leloudas, G., Taubenberger, S., et al. 2011, MNRAS, 413, 3075 [NASA ADS] [CrossRef] [Google Scholar]
- Pastorello, A., Mazzali, P. A., Pignata, G., et al. 2007, MNRAS, 377, 1531 [NASA ADS] [CrossRef] [Google Scholar]
- Patat, F., Benetti, S., Cappellaro, E., et al. 1996, MNRAS, 278, 111 [NASA ADS] [CrossRef] [Google Scholar]
- Perlmutter, S., Aldering, G., Goldhaber, G., et al. 1999, ApJ, 517, 565 [NASA ADS] [CrossRef] [Google Scholar]
- Phillips, M. M., Lira, P., Suntzeff, N. B., et al. 1999, AJ, 118, 1766 [NASA ADS] [CrossRef] [Google Scholar]
- Pignata, G., Patat, F., Benetti, S., et al. 2004, MNRAS, 355, 178 [NASA ADS] [CrossRef] [Google Scholar]
- Pignata, G., Benetti, S., Mazzali, P. A., et al. 2008, MNRAS, 388, 971 [NASA ADS] [CrossRef] [Google Scholar]
- Riess, A. G., Filippenko, A. V., Challis, P., et al. 1998, AJ, 116, 1009 [NASA ADS] [CrossRef] [Google Scholar]
- Riess, A. G., Li, W., Stetson, P. B., et al. 2005, ApJ, 627, 579 [NASA ADS] [CrossRef] [Google Scholar]
- Schlegel, D. J., Finkbeiner, D. P., & Davis, M. 1998, ApJ, 500, 525 [NASA ADS] [CrossRef] [Google Scholar]
- Sollerman, J., Lindahl, J., Kozma, C., et al. 2004, A&A, 428, 555 [NASA ADS] [CrossRef] [EDP Sciences] [Google Scholar]
- Stanishev, V., Goobar, A., Benetti, S., et al. 2007, A&A, 469, 645 [NASA ADS] [CrossRef] [EDP Sciences] [Google Scholar]
- Stritzinger, M., Burns, C. R., Phillips, M. M., et al. 2010, AJ, 140, 2036 [NASA ADS] [CrossRef] [Google Scholar]
- Tanaka, M., Mazzali, P. A., Benetti, S., et al. 2008, ApJ, 677, 448 [NASA ADS] [CrossRef] [Google Scholar]
- Thomas, R. C., Nugent, P. E., & Meza, J. C. 2011, PASP, 123, 237 [NASA ADS] [CrossRef] [Google Scholar]
- Wang, X., Filippenko, A. V., Ganeshalingam, M., et al. 2009a, ApJ, 699, L139 [NASA ADS] [CrossRef] [Google Scholar]
- Wang, X., Li, W., Filippenko, A. V., et al. 2009b, ApJ, 697, 380 [NASA ADS] [CrossRef] [Google Scholar]
All Tables
All Figures
|
Fig. 1 Reddening-corrected colors of our sample of Type Ia supernovae. |
| In the text | |
|
Fig. 2 (top) (U − B)0 vs. Vneb at two different epochs. r is the linear correlation coeficient. (bottom) same as above but for (V − I)0. |
| In the text | |
|
Fig. 3 Spectral evolution at −4 days since maximum as a function of nebular velocity shift (Vneb). The observed spectra in black and syn++ models in red (dot-dashed lines). The spectra are redshift and extinction corrected (RV = 3.1). The dashed lines correspond to the expected rest-frame wavelength of and IR-triplet Ca II lines and the spectra in the figure correspond to SN 1994D (Patat et al. 1996), SN 2002bo (Benetti et al. 2004), SN 2002dj (Pignata et al. 2008), SN 2002er (Kotak et al. 2005), SN 2003du (Sollerman et al. 2004), SN 2004eo (Pastorello et al. 2007), SN 2005cf (Bufano et al. 2009). |
| In the text | |
|
Fig. 4 (U − B)0 and (V − I)0 color differences from models of the spectra shown in Fig. 3, and the same spectra after removing the and IR-triplet Ca II lines. |
| In the text | |
Current usage metrics show cumulative count of Article Views (full-text article views including HTML views, PDF and ePub downloads, according to the available data) and Abstracts Views on Vision4Press platform.
Data correspond to usage on the plateform after 2015. The current usage metrics is available 48-96 hours after online publication and is updated daily on week days.
Initial download of the metrics may take a while.