Fig. 3
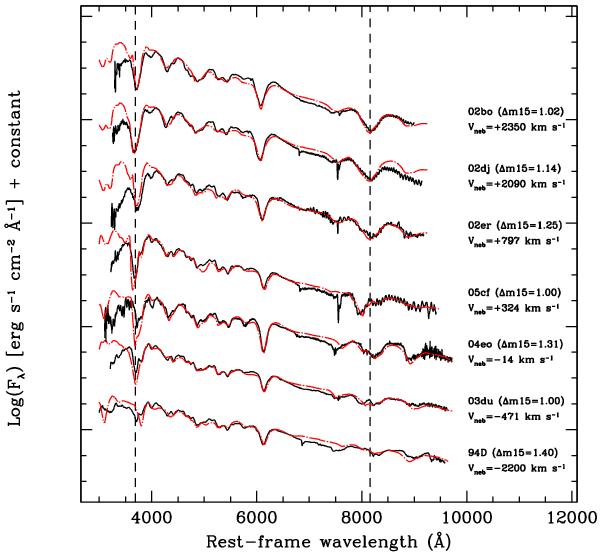
Spectral evolution at −4 days since maximum as a function of nebular velocity shift (Vneb). The observed spectra in black and syn++ models in red (dot-dashed lines). The spectra are redshift and extinction corrected (RV = 3.1). The dashed lines correspond to the expected rest-frame wavelength of and IR-triplet Ca II lines and the spectra in the figure correspond to SN 1994D (Patat et al. 1996), SN 2002bo (Benetti et al. 2004), SN 2002dj (Pignata et al. 2008), SN 2002er (Kotak et al. 2005), SN 2003du (Sollerman et al. 2004), SN 2004eo (Pastorello et al. 2007), SN 2005cf (Bufano et al. 2009).
Current usage metrics show cumulative count of Article Views (full-text article views including HTML views, PDF and ePub downloads, according to the available data) and Abstracts Views on Vision4Press platform.
Data correspond to usage on the plateform after 2015. The current usage metrics is available 48-96 hours after online publication and is updated daily on week days.
Initial download of the metrics may take a while.