| Issue |
A&A
Volume 534, October 2011
|
|
|---|---|---|
| Article Number | A103 | |
| Number of page(s) | 6 | |
| Section | Stellar atmospheres | |
| DOI | https://doi.org/10.1051/0004-6361/201117658 | |
| Published online | 14 October 2011 | |
Statistical equilibrium of silicon in the atmospheres of nearby metal-poor stars⋆
1
National Astronomical Observatories, Chinese Academy of
Sciences,
Beijing
100012,
PR China
e-mail: This email address is being protected from spambots. You need JavaScript enabled to view it.
2
Universitäts-Sternwarte München, Scheinerstrasse 1, 81679
München,
Germany
Received: 8 July 2011
Accepted: 23 August 2011
Abstract
Aims. We discuss the statistical equilibrium of neutral and ionized silicon in the atmospheres of nearby metal-poor stars. We investigated the effects of non-local thermodynamic equilibrium (NLTE) and determined the silicon abundances.
Methods. We used high resolution, high signal-to-noise ratio spectra from the FOCES spectragraph at the DSAZ telescope. Line-formation calculations of Si i and Si ii in the atmospheres of nearby metal-poor stars are presented. All abundance results are derived from local thermodynamic equilibrium (LTE) and NLTE statistical equilibrium calculations and spectrum synthesis methods.
Results. We find that NLTE effects for Si ii optical lines are important for warm stars, and that they depend on effective temperature. The Si abundances of thin and thick disc stars follow distinct trends, as in the case of Mg. We find that [Si/Fe] gradually increases as [Fe/H] decreases in thin disc stars, while it remains around at ~+0.30 dex for halo and thick disc stars, the halo stars showing larger scatter.
Conclusions. The derived dependence between [Si/Fe] and [Fe/H] is inconsistent with the theoretical predictions of published model calculations for the chemical evolution of the Galaxy. The nearly constant [Si/Mg] ratio with some scatter for halo and thick disc stars suggests that the nucleosynthesis of silicon is closely coupled to that of Mg. In addition, our results do not support the suggestion that type Ia supernove produce significant amounts of silicon.
Key words: stars: abundances / stars: late-type / line: profiles / line: formation / Galaxy: evolution
Based on observations collected at the German-Spanish Astronomical Center, Calar Alto, Spain.
© ESO, 2011
1. Introduction
In a similar way to the 24Mg nucleus, 28Si is an important α element, and the abundance ratio Si/Fe in stars can provide valuable insight into the history of Galactic nucleosynthesis. From a stellar nucleosynthesis point of view, this element should have very similar properties to those found in Mg in metal-poor stars (Woosley & Weaver 1995). The central question with respect to silicon is whether 28Si is synthesized by type Ia supernove. The current paradigm is that silicon is produced during oxygen and neon burning in massive stars, hence subsequently ejected by type II supernove (Woosley & Weaver 1995; Umeda et al. 2000; Ohkubo et al. 2006). Type Ia supernove also produce significant amounts of silicon (Tsujimoto et al. 1995; Iwamoto et al. 1999; Thielemann et al. 2002; Maeda et al. 2010).
Previous abundance determinations of Si have been carried out under the assumption of local thermodynamic equilibrium (LTE). The corresponding results for metal-poor stars have been similar to those for Mg in that both element abundances have a few typical features:
-
As found for Mg, there is a clear distinction between [Si/Fe] forthin- and thick disc stars, namely, the thick-disc is, at a given[Fe/H], more enhanced in [Si/Fe] than the thin disc (Bensbyet al. 2003, 2005; Reddy et al. 2003,2006).
-
The thick disc [Si/Fe] ratios smoothly merge with the halo ratios in the overlapping metallicity range (Fulbright 2002).
In present work, we study a sample of metal-poor stars to explore their [Si/Fe] abundance ratios by applying a full spectrum synthesis based on level populations calculated from the statistical equilibrium equations, and to investigate whether 28Si is contaminated substantially by synthesis in type Ia supernovae. In Sect. 2, we present the observational technique and the atmospheric models. Stellar parameters are discussed in Sect. 3. NLTE line formation follows in Sect. 4. Our results and comparison with other work are shown in Sect. 5. Our discussion is presented in Sect. 6, and the conclusions are given in Sect. 7.
2. Observations
The high-resolution spectra analysed in our present investigation were obtained with the FOCES fiber optics échelle spectrograph fed by the 2.2 m telescope of the DSAZ at Calar Alto Observatory during August 2001 and January 2003. The observations cover a spectral range from 3700 Å to 9800 Å in a total of 97 spectral orders. The spectra were exposed on a 20482 CCD chip with 24 μm pixel size, providing a spectral resolving power of R ~ 40 000. All stars were observed at least twice with S/N ~ 100 to 200.
Data extraction followed the standard automatic IDL program environment designed for the FOCES spectrograph (Pfeiffer et al. 1998). All échelle images including flat field and ThAr were corrected for bias and scattered light background. Objects and ThAr exposures were extracted and corrected for the flat-field response. Bad pixels were detected and as far as possible removed by comparing two or more single exposures (see Gehren et al. 2004, 2006, for details).
3. Method of calculation
3.1. Model atmospheres
We use line-blanketed LTE model atmospheres, generated as discussed by Fuhrmann et al. (1997). The main characteristics are: (1) the iron opacity, which was calculated with the improved meteoritic value log εFe = 7.51 (Anders & Grevesse 1989); (2) opacities for metal-poor stars with [Fe/H] < −0.6, which were calculated using α-element (O, Mg, Si, and Ca) abundances enhanced by 0.4 dex; and (3) the mixing-length parameter l/Hp, which was adopted to be 0.5, in order to determine consistent temperatures for Hα and the higher Balmer lines (see Fuhrmann et al. 1993).
3.2. Stellar parameters
We aim to remain consistent with the whole series of our earlier NLTE studies from Baumüller & Gehren (1996), Zhao et al. (1998), Zhao & Gehren (2000) to the most recent paper of Shi et al. (2009, hereafter Paper II) and Bergemann & Cescutti (2010). We therefore adopt the stellar parameters for the sample stars determined by Gehren et al. (2004, 2006), where the effective temperatures are derived from the wings of the Balmer lines based on the hydrogen resonance broadening calculated with the Ali & Griem (1966) theory. We note that two papers of Barklem et al. (2000a) and Allard et al. (2008) obtain larger values of the hydrogen self-broadening cross-sections. An impact of using the self-broadening formalism of Barklem et al. (2000a) on effective temperature determinations for metal-poor stars is discussed by Mashonkina et al. (2008). The surface gravities are based on the HIPPARCOS parallaxes. Iron abundances are obtained from Fe ii lines, and the microturbulence velocities are estimated by requiring that the iron abundance derived from Fe ii lines should not depend on equivalent width. The estimated uncertainties in the temperature, surface gravity, metal abundance, and microturbulence velocity are for most stars ±80 K, 0.10 dex, 0.05 dex, and 0.2 km s-1, respectively.
3.3. Atomic line data
Table 1 lists the relevant line data with their final solar fit values (Shi et al. 2008, hereafter Paper I). Collisional broadening caused by the van der Waals interaction with hydrogen atoms is important only for strong Si lines. As already pointed out by Gehren et al. (2001, 2004), the resulting values of the van der Waals damping constants are almost always close to those calculated according to tables of Anstee & O’Mara’s (1991, 1995) and Barklem et al.’s (2000b). In our analysis, the absolute value of the oscillator strengths is unimportant because the abundances are evaluated in a fully differential way with respect to the Sun.
Atomic data of silicon lines.
4. NLTE calculations
4.1. Atomic model
The silicon model atom includes the most important levels of Si i and Si ii and comprises 132 terms of Si i, 41 terms of Si ii, and the Si iii ground state. The atomic properties are documented in Shi et al. (Paper I and II).
All calculations are carried out with a revised version of the DETAIL program (Butler & Giddings 1985) using accelerated lambda iteration (see Gehren et al. 2001, 2004, for details).
4.2. NLTE effects
The abundance analyses of both Si i and Si ii lines clearly display the NLTE effects. We note that the NLTE effects differ from line to line, as we discussed in Paper II the strong Si i lines at 3905 and 4102 Å are quite strongly affected by NLTE effects for warm metal-poor stars, while the abundances measured for weak lines are the least affected by NLTE effects (<0.02 dex), although the NLTE effects are slightly larger for the weak infrared lines (~0.05 dex).
Similar to the Ca ii lines, the NLTE abundance corrections for the two Si ii lines are negative (Mashonkina et al. 2007). We find that the NLTE correction is large for high temperature stars, and even larger than 0.2 dex for warm stars. For our program stars, the abundance differences between the LTE and NLTE analyses of the Si ii lines are plotted in Fig. 1 as a function of metallicity ([Fe/H]), effective temperature, and surface gravity, respectively. There is a clear trend where the NLTE effects increase with increasing temperature.
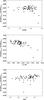 |
Fig. 1 Difference of [Si ii/Fe] abundance ratios calculated under the assumptions of NLTE and LTE as a function of metal abundance a), temperature b), and surface gravity c). |
5. Results
5.1. Stellar silicon abundances
We determinate the silicon abundances of our program stars using spectral synthesis. The synthetic spectra are convolved with macroturbulence, rotational, and instrumental broadening profiles, in order to match the observed spectral lines. Our NLTE abundance results do not show a large abundance discrepancy between different lines; the final abundance scatter of single lines is between 0.01 and 0.1. The derived abundances are presented in Table 2, which is available in the electronic version of this paper.
5.2. Comparison with other work
Silicon abundances for metal-poor stars have been determined by several groups based on LTE analyses. By comparing the abundances of stars in common, we have verified that the different studies are consistent. In Fig. 2, we compare the [Si/Fe] values (assuming NLTE) determined in this paper with those from the literature. Some systematic differences can be seen from this figure, which in the remaining part of this section, we briefly try to explain.
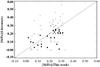 |
Fig. 2 Comparison of derived [Si/Fe] (NLTE) for stars in common with other studies. Open triangles (△ ) are from Bensby et al. (2003, 2005), crosses (× ) are from Decauwer et al. (2005), open circles (°) are from Fulbright (2000, 2002), asterisks (∗ ) are from Gratton et al. (2003), and filled circles (•) are from Reddy et al. (2003, 2006). |
Using high resolution, high signal-to-noise ratio spectra of 168 F to K dwarf stars, Bensby et al. (2003, 2005) confirmed the overabundance ratio [Si/Fe] of thick-disc stars. Their results were determined using the weak Si i lines. Their gf values were adopted from the laboratory work of Garz (1973) and its revision by Becker et al. (1980), and are very similar to ours. We have four stars in common with this work, the mean difference between them and us is ![Mathematical equation: \hbox{$\overline{\Delta \rm[Si/Fe]}$}](/articles/aa/full_html/2011/10/aa17658-11/aa17658-11-eq72.png) = 0.03 ± 0.06.
= 0.03 ± 0.06.
Decauwer et al. (2005) analysed a sample of moderately metal-poor stars of which three were analysed by ourselves. They used weak Si i lines to determine their Si abundances, and the gf values adopted in their study are nearly the same as those used here. The difference is = 0.01 ± 0.096 between their and our measurements. In Paper II, we proposed that the optical Si i lines are very weak in metal-poor stars, so the determination of the continuum is difficult. The large scatter is mostly due to the uncertainty in determining the continuum.
The analysis of Fulbright (2000, 2002) deals with 168 metal-poor stars of which 22 stars are in common with our sample. For the 22 stars in common with our list, we find that = 0.09 ± 0.086. They used weak Si i lines to determine the silicon abundances, and took the log gf values from the laboratory work of Garz (1973), thus their gf values are about 0.1 dex lower then ours, and this difference in gf might explain the discrepancies.
Gratton et al. (2003) determined the silicon abundances of 150 field subdwarfs and subgiants. They used the weak optical Si i lines, and adopted the gf values of Garz’s (1973). Our results mostly agree with theirs. For the 23 stars in common, the average difference is 0.003 ± 0.09.
Reddy et al. (2003, 2006) analysed a large sample of nearby thin- and thick-disc stars based on the optical Si i lines. The gf values adopted in this study are nearly the same as the values we adopted. The results of Reddy et al. are in agreement with ours. For the 24 common stars from Reddy et al., the average difference between their measurements and ours is −0.05 ± 0.059.
6. Discussion
6.1. Si i/Si ii ionization equilibrium in metal-poor stars
Our discussion is based on the stars with Si abundances determined from both Si i and Si ii lines in our present sample and the nine stars from Paper II, and excellent agreement between the two ionization stages is achieved when NLTE effects are included. The average difference of ![Mathematical equation: \hbox{$\overline {\Delta\rm[\ion{Si}{i}/Fe]-[\ion{Si}{ii}/Fe]}$}](/articles/aa/full_html/2011/10/aa17658-11/aa17658-11-eq86.png) is −0.03 ± 0.019. The difference in the [Si/Fe] abundance ratios calculated under LTE and NLTE as a function of surface gravity for these stars is plotted in Fig. 3. The conclusion that the NLTE leads to consistent Si abundances derived from the two ionization stages is obviously supported by this figure.
is −0.03 ± 0.019. The difference in the [Si/Fe] abundance ratios calculated under LTE and NLTE as a function of surface gravity for these stars is plotted in Fig. 3. The conclusion that the NLTE leads to consistent Si abundances derived from the two ionization stages is obviously supported by this figure.
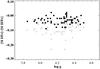 |
Fig. 3 Difference of [Si/Fe] abundance ratios calculated under NLTE and LTE assumptions as a function of log g. Filled circles (•) represent data derived from a NLTE analysis, while open circles (°) are those for LTE analysis. |
6.2. Silicon abundance and nucleosynthesis in the early Galaxy
The variation in [Si/Fe] as a function of [Fe/H] contains information about the chemical evolution of the Galaxy. Figure 4 displays the dependence of [Si/Fe] (calculated for NLTE) on the metal abundance for all stars considered in both this paper and Paper II. The important features that can be seen from Fig. 4 are that, although there is scatter, the bulk of the [Si/Fe] ratios are around +0.3 for our halo and thick disc program stars, while the [Si/Fe] ratios decrease with increasing [Fe/H] for thin disc stars. The exceptions are the five moderately metal-poor stars, namely, BD + 20° 2594, CD −51° 4628, G 170-56, HD 122196, and HD 224930, which have relatively low [Si/Fe] values. We note that the first four stars also have lower values of magnesium. Such type stars were also found and discussed by Nissen & Schuster (1997, 2010) and Cohen et al. (2007, 2008). The star HD 224930 is in fact a spectroscopic binary, whose Ca ii H+K lines show evidence of core emission (see Gehren et al. 2004). We also found that one thick disc star HD 46341 has a slightly low Si abundance ([Si/Mg] = 0.07). We note that its Mg abundance is higher than 0.25 ([Mg/Fe] = 0.26), while the Ca abundance is also low ([Ca/Fe] = 0.11). According to its rotational velocity (V > −62 km s-1) it is more likely to be part of the thin disc population (Ibukiyama & Arimoto 2002).
Several groups (e.g. Timmes et al. 1995; Samland 1998; Goswami & Prantzos 2000; Kobayashi et al. 2006) have modelled the Galactic chemical evolution of silicon. Goswami & Prantzos (2000) and Kobayashi et al. (2006) predicted that the [Si/Fe] ratios decrease from [Fe/H] ~ −4 to [Fe/H] ~ 0, while Samland (1998) presented a nearly flat [Si/Fe] ratio for metal-poor stars. However, Timmes et al. (1995) showed that [Si/Fe] increases from [Fe/H] ~−3 to ~−2, while it decreases from [Fe/H] ~−2 to ~−0.8, with a nearly flat ratio (~0.2) for thin disc stars (see their Fig. 21). Our observational results for disc and halo stars are consistent with the theoretical predictions of Samland (1998), the flat [Si/Fe] trend of the thick disc and halo stars not being predicted by the other three theoretical models.
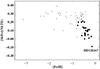 |
Fig. 4 Abundance ratios [Si/Fe] as a function of [Fe/H]. Filled circles (•) represent thin disc stars, open circles (°) thick disk stars, the asterisks (∗) halo stars, and cross(× ) peculiar stars. |
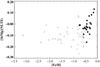 |
Fig. 5 Abundance ratios [Si/Mg] for the NLTE analysis as a function of [Fe/H]. Symbols are the same as in Fig. 4. |
Usually magnesium is used as the main tracer for assessing the metallicity dependence. It has been suggested that nearly all magnesium is produced in massive stars (Timmes et al. 1995), hence using magnesium instead of iron as the reference can help us to disregard type Ia SNe. The overall behaviour of the [Si/Mg] ratios versus [Fe/H] is shown in Fig. 5, where NLTE magnesium abundances are taken from Gehren et al. (2004, 2006) and Mashonkina et al. (2008). Although there is some scatter, our result shows that the [Si/Mg] ratio is around −0.1 for halo and thick disc stars, and the thin disc [Si/Mg] ratios smoothly merge with the thick disc ratios in the overlapping metallicity range.
Nearly all oxygen is proposed to be produced in type II SNe (Timmers et al. 1995), and oxygen abundances appear to be overabundant for metal-poor stars (Nissen et al. 2002; Ramírez et al. 2007). In contrast most of the silicon is assumed to be synthesized in moderate-mass type II SNe (Woosley & Weaver 1995), and type Ia SNe should also produce some silicon (Tsujimoto et al. 1995; Iwamoto et al. 1999; Thielemann et al. 2002; Maeda et al. 2010). The nearly constant [Si/Mg] ratio that has a small scatter for thick disc and halo stars suggests that the nucleosynthesis of silicon is closely coupled to that of the magnesium. The prediction, that type Ia SNe produce some amount of silicon, may not be supported by our result, that the thin disc [Si/Mg] ratios smoothly merge with the thick disc ratios in the overlapping metallicity range.
7. Conclusions
We have determined silicon abundances for 67 metal-poor stars, spanning the range −1.9 < [Fe/H] < ~ 0.0. All abundances are derived from NLTE statistical equilibrium calculations. On the basis of our results, we come to the following conclusions:
-
1.
There is a clear separation between [Si/Fe] for thin- and thickdisc stars, the [Si/Fe] ratios are overabundant for thick disc stars.However, the number of thin/thick disc stars with overlappingmetallicities needs to be increased to verify these trends. Inaddition, there is an indication that [Si/Fe] decreases withincreasing metallicity for thin disc stars, while the [Si/Mg] ratiosare around −0.1 for halo and thick disc stars.
-
2.
The NLTE effects are different from line to line. The weak lines are quite insensitive to NLTE effects, while the infrared lines show small NLTE effects, although these effects are smaller than 0.05 dex. For the two Si ii lines, NLTE leads to enhanced absorption in the line cores and negative abundance corrections over the range of stellar parameters studied here, the effects of which depend on the temperature, hence tends to be large for warm stars.
-
3.
Our results confirm that NLTE largely removes obvious discrepancies between Si i and Si ii obtained under the LTE assumption.
-
4.
Our results suggest that, in a similar way to magnesium, silicon is produced by massive type II SNe, while SN Ia should not contribute significantly to Si.
Acknowledgments
This research was supported by the National Natural Science Foundation of China under grant Nos. 10821061, 10878024, 109730161 and 11021504, by the Deutsche Forschungsgemeinschaft with grant 446 CHV 112/1,2.
References
- Ali, A. W., & Griem, H. R., 1966, Phys. Rev., 144, 366 [NASA ADS] [CrossRef] [Google Scholar]
- Allard, N. F., Kielkopf, J. F., Cayre, R., van’t Veer-Menneret, C. 2008, A&A, 480, 581 [NASA ADS] [CrossRef] [EDP Sciences] [Google Scholar]
- Anders, E., & Grevesse, N. 1989, Geochim. Cosmochim. Acta, 53, 197 [Google Scholar]
- Anstee, S. D., & O’Mara, B. J. 1991, MNRAS, 253, 549 [Google Scholar]
- Anstee, S. D., & O’Mara, B. J. 1995, MNRAS, 276, 859 [NASA ADS] [CrossRef] [Google Scholar]
- Barklem, P. S., Piskunov, N., & O’Mara, B. J. 2000a, A&A, 355, L5 [NASA ADS] [Google Scholar]
- Barklem, P. S., Piskunov, N., & O’Mara, B. J. 2000b, A&AS, 142, 467 [NASA ADS] [CrossRef] [EDP Sciences] [MathSciNet] [PubMed] [Google Scholar]
- Baumüller, D., & Gehren, T. 1996, A&A, 307, 961 [NASA ADS] [Google Scholar]
- Becker, U., Zimmermann, P., & Holweger, H. 1980, Geochim. Cosmochim. Acta, 44, 2145 [NASA ADS] [CrossRef] [Google Scholar]
- Bensby, T., Feltzing, S., & Lundström, I. 2003, A&A, 410, 527 [NASA ADS] [CrossRef] [EDP Sciences] [Google Scholar]
- Bensby, T., Feltzing, S., Lundström, I., & Ilyin, I. 2005, A&A, 433, 185 [NASA ADS] [CrossRef] [EDP Sciences] [Google Scholar]
- Bergemann, M., & Cescutti, G. 2010, A&A, 522, A9 [NASA ADS] [CrossRef] [EDP Sciences] [Google Scholar]
- Butler, K., & Giddings, J. 1985, Newsletter on the analysis os astronomical spectra No. 9, University of London [Google Scholar]
- Cohen, J. G., Christlieb, N., McWilliam, A., et al. 2008, ApJ, 672, 230 [Google Scholar]
- Cohen, J. G., McWilliam, A., Christlieb, N., et al. 2007, ApJ, 659, L161 [NASA ADS] [CrossRef] [Google Scholar]
- Decauwer, H., Jehin, E., Parmentier, G., & Magain, P. 2005, A&A, 433, 285 [NASA ADS] [CrossRef] [EDP Sciences] [Google Scholar]
- Fuhrmann, K., Axer, M., & Gehren, T. 1993, A&A, 271, 451 [NASA ADS] [Google Scholar]
- Fuhrmann, K., Pfeiffer, M., Frank, C., et al. 1997, A&A, 323, 909 [NASA ADS] [Google Scholar]
- Fulbright, J. P. 2000, AJ, 120, 1841 [NASA ADS] [CrossRef] [Google Scholar]
- Fulbright, J. P. 2002, AJ, 123, 404 [NASA ADS] [CrossRef] [Google Scholar]
- Garz, T. 1973, A&A, 26, 471 [NASA ADS] [Google Scholar]
- Gehren, T., Butler, K., Mashonkina, L., et al. 2001, A&A, 366, 981 [NASA ADS] [CrossRef] [EDP Sciences] [Google Scholar]
- Gehren, T., Liang, Y. C., Shi, J. R., et al. 2004, A&A, 413, 1045 [NASA ADS] [CrossRef] [EDP Sciences] [Google Scholar]
- Gehren, T., Shi, J. R., Zhang, H. W., Zhao, G., & Korn, A. J. 2006, A&A, 451, 1065 [NASA ADS] [CrossRef] [EDP Sciences] [Google Scholar]
- Goswami, A., & Prantzos, N. 2000, A&A, 359, 191 [NASA ADS] [Google Scholar]
- Gratton, R. G., Carretta, E., Claudi, R., et al. 2003, A&A, 404, 187 [NASA ADS] [CrossRef] [EDP Sciences] [Google Scholar]
- Ibukiyama, A., & Arimoto, N. 2002, A&A, 394, 927 [NASA ADS] [CrossRef] [EDP Sciences] [Google Scholar]
- Iwamoto, K., Brachwitz, F., Nomoto, K., et al. 1999, ApJS, 125, 439 [NASA ADS] [CrossRef] [MathSciNet] [Google Scholar]
- Kobayashi, C., Umeda, H., Nomoto, K., Tominaga, N., & Ohkubo, T. 2006, ApJ, 653, 1145 [NASA ADS] [CrossRef] [Google Scholar]
- Korn, A., Shi, J. R., & Gehren, T. 2003, A&A, 407, 691 [NASA ADS] [CrossRef] [EDP Sciences] [Google Scholar]
- Maeda, K., Röpke, F. K., Fink, M., et al. 2010, ApJ, 712, 624 [NASA ADS] [CrossRef] [Google Scholar]
- Mashonkina, L., Korn, A., & Przybilla, N. 2007, A&A, 461, 261 [NASA ADS] [CrossRef] [EDP Sciences] [Google Scholar]
- Mashonkina, L., Zhao, G., Gehren, T., et al. 2008, A&A, 478, 529 [NASA ADS] [CrossRef] [EDP Sciences] [Google Scholar]
- Mashonkina, L., Gehren, T., Shi, J. R., Korn, A., & Gruup, F. 2011, A&A, 528, A87 [NASA ADS] [CrossRef] [EDP Sciences] [Google Scholar]
- Nissen, P. E., & Schuster, W. J. 1997, A&A, 326, 751 [NASA ADS] [Google Scholar]
- Nissen, P. E., & Schuster, W. J. 2010, A&A, 511, L10 [NASA ADS] [CrossRef] [EDP Sciences] [Google Scholar]
- Nissen, P. E., Primas, F., Asplund, M., & Lambert, D. L. 2002, A&A, 390, 235 [NASA ADS] [CrossRef] [EDP Sciences] [Google Scholar]
- Ohkubo, T., Umeda, H., Maeda, K., et al. 2006, ApJ, 645, 1352 [NASA ADS] [CrossRef] [Google Scholar]
- Pfeiffer, M. J., Frank, C., Baumüller, D., et al. 1998, A&AS, 130, 381 [NASA ADS] [CrossRef] [EDP Sciences] [Google Scholar]
- Ramírez, I., Allen de Prieto, C., & Lambert, D. L. 2007, A&A, 465, 271 [NASA ADS] [CrossRef] [EDP Sciences] [Google Scholar]
- Reddy, B. E., Lambert, D. L., & Allen de Prieto, C. 2006, MNRAS, 367, 1329 [NASA ADS] [CrossRef] [Google Scholar]
- Reddy, B. E., Tomkin, J., Lambert, D. L., & Allen de Prieto, C. 2003, MNRAS, 340, 304 [NASA ADS] [CrossRef] [Google Scholar]
- Samland, M. 1998, ApJ, 496, 155 [NASA ADS] [CrossRef] [Google Scholar]
- Shi, J. R., Gehren, T., Butler, K., Mashonkina, L., & Zhao, G. 2008, A&A, 486, 303 (Paper I) [NASA ADS] [CrossRef] [EDP Sciences] [Google Scholar]
- Shi, J. R., Gehren, T., Mashonkina, L., & Zhao, G. 2009, A&A, 503, 533 (Paper II) [NASA ADS] [CrossRef] [EDP Sciences] [Google Scholar]
- Thielemann, K. K., Argast, D., Brachwitz, F., et al. 2002, ApSS, 281, 25 [Google Scholar]
- Timmes, F. X., Woosley, S. E., & Weaver, T. A. 1995, ApJS, 98, 617 [NASA ADS] [CrossRef] [Google Scholar]
- Tsujimoto, T., Nomoto, K., Yoshii, Y., et al. 1995, MNRAS, 277, 945 [NASA ADS] [CrossRef] [Google Scholar]
- Umeda, H., Nomoto, K., & Nakamura, T. 2000, in The first Stars, ed. A. Weiss, T. Abel, & V. Hill (Heidelberg: Springer), 150 [Google Scholar]
- Woosley, S. E., & Weaver, T. A. 1995, ApJS, 101, 181 [NASA ADS] [CrossRef] [Google Scholar]
- Zhao, G., & Gehren, T. 2000, A&A, 362, 1077 [NASA ADS] [Google Scholar]
- Zhao, G., Butler, K., & Gehren, T. 1998, A&A, 333, 219 [NASA ADS] [Google Scholar]
All Tables
All Figures
|
Fig. 1 Difference of [Si ii/Fe] abundance ratios calculated under the assumptions of NLTE and LTE as a function of metal abundance a), temperature b), and surface gravity c). |
| In the text | |
|
Fig. 2 Comparison of derived [Si/Fe] (NLTE) for stars in common with other studies. Open triangles (△ ) are from Bensby et al. (2003, 2005), crosses (× ) are from Decauwer et al. (2005), open circles (°) are from Fulbright (2000, 2002), asterisks (∗ ) are from Gratton et al. (2003), and filled circles (•) are from Reddy et al. (2003, 2006). |
| In the text | |
|
Fig. 3 Difference of [Si/Fe] abundance ratios calculated under NLTE and LTE assumptions as a function of log g. Filled circles (•) represent data derived from a NLTE analysis, while open circles (°) are those for LTE analysis. |
| In the text | |
|
Fig. 4 Abundance ratios [Si/Fe] as a function of [Fe/H]. Filled circles (•) represent thin disc stars, open circles (°) thick disk stars, the asterisks (∗) halo stars, and cross(× ) peculiar stars. |
| In the text | |
|
Fig. 5 Abundance ratios [Si/Mg] for the NLTE analysis as a function of [Fe/H]. Symbols are the same as in Fig. 4. |
| In the text | |
Current usage metrics show cumulative count of Article Views (full-text article views including HTML views, PDF and ePub downloads, according to the available data) and Abstracts Views on Vision4Press platform.
Data correspond to usage on the plateform after 2015. The current usage metrics is available 48-96 hours after online publication and is updated daily on week days.
Initial download of the metrics may take a while.