Free Access
Fig. 3
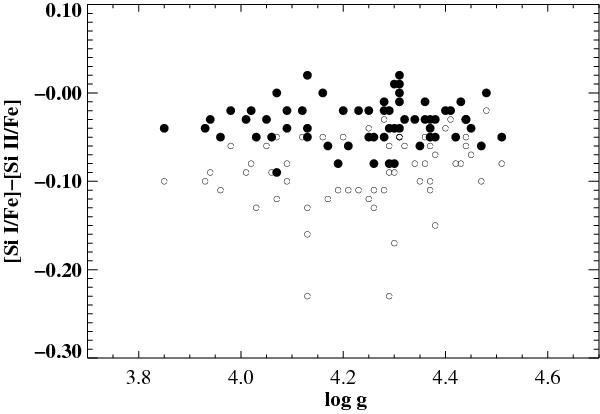
Difference of [Si/Fe] abundance ratios calculated under NLTE and LTE assumptions as a function of log g. Filled circles (•) represent data derived from a NLTE analysis, while open circles (°) are those for LTE analysis.
Current usage metrics show cumulative count of Article Views (full-text article views including HTML views, PDF and ePub downloads, according to the available data) and Abstracts Views on Vision4Press platform.
Data correspond to usage on the plateform after 2015. The current usage metrics is available 48-96 hours after online publication and is updated daily on week days.
Initial download of the metrics may take a while.