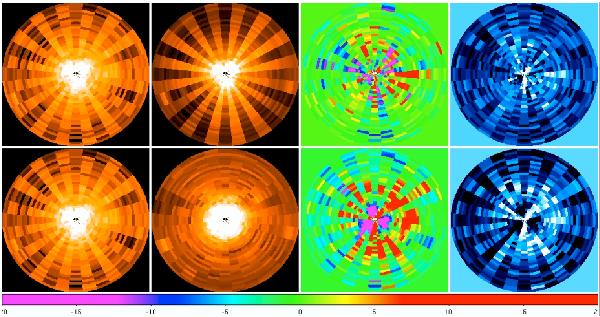
Fig. 8

Comparing the SAS-produced 2D PSFs and default PSFs with true source data. Left to right: (1) the stacked counts in the data; (2) the stacked counts in the model; (3) a χ2-like statistic; (4) r, a measure of whether the model consistently (white) under- or (black) overestimates the data (see text for all details), for (top) the 2D PSF and (bottom) the default PSF. The colourbar corresponds to the χ2 plot. The 30 radial bins are each 4″ wide, and the 32 azimuthal bins are each 11.25° wide, and arranged to be alternately fully on-spoke, then fully off-spoke. The example shown is for MOS2, on-axis, 0.5−1 keV.
Current usage metrics show cumulative count of Article Views (full-text article views including HTML views, PDF and ePub downloads, according to the available data) and Abstracts Views on Vision4Press platform.
Data correspond to usage on the plateform after 2015. The current usage metrics is available 48-96 hours after online publication and is updated daily on week days.
Initial download of the metrics may take a while.


