Fig. 2
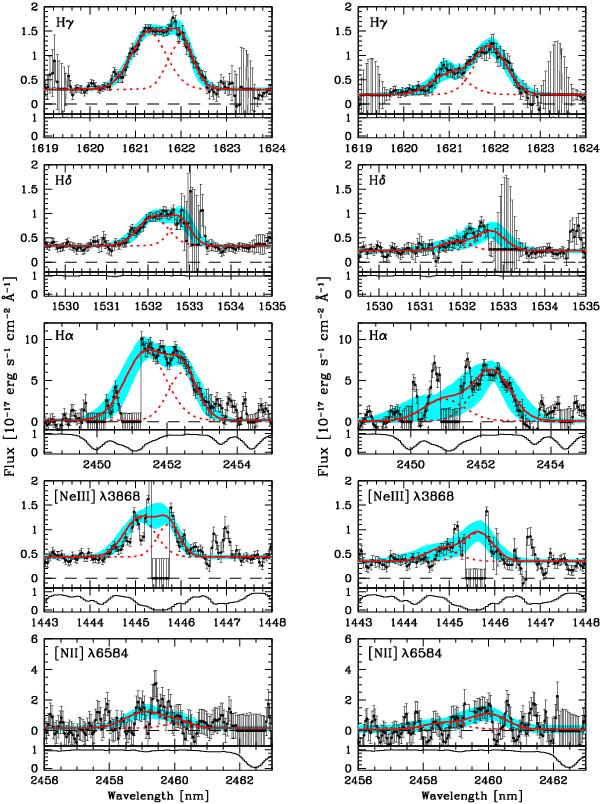
Selection of nebular emission lines, free from strong atmospheric absorption, detected in the lensed image A2 (left-hand panels) and in the lensed image A3 (right-hand panels) of the 8 o’clock arc. In all panels, the black histogram represents the flux-calibrated data with 1σ errors as a function of vacuum-heliocentric-corrected wavelengths. The red continuous line is the best-fitted profile, and the red dotted line shows the fit of the two best individual Gaussian components with the respective parameters given in Table 3. The cyan shaded area represents 68% of the Monte Carlo runs, generated from the perturbation of the observed spectrum with a random realization of the error spectrum. The respective atmospheric transmission is plotted below each panel. The flux is set to zero (with large error bars) whenever the atmospheric transmission falls below 10%.

Current usage metrics show cumulative count of Article Views (full-text article views including HTML views, PDF and ePub downloads, according to the available data) and Abstracts Views on Vision4Press platform.
Data correspond to usage on the plateform after 2015. The current usage metrics is available 48-96 hours after online publication and is updated daily on week days.
Initial download of the metrics may take a while.