| Issue |
A&A
Volume 532, August 2011
|
|
|---|---|---|
| Article Number | A132 | |
| Number of page(s) | 5 | |
| Section | Atomic, molecular, and nuclear data | |
| DOI | https://doi.org/10.1051/0004-6361/201117371 | |
| Published online | 04 August 2011 | |
UV action spectroscopy of protonated PAH derivatives
Methyl substituted quinolines
1
Department of Physics and AstronomyAarhus University, Ny Munkegade 120, 8000 Aarhus C, Denmark
e-mail: This email address is being protected from spambots. You need JavaScript enabled to view it.
2
Institute for Storage Ring Facilities, Aarhus University, Ny Munkegade 120, 8000 Aarhus C, Denmark
Received: 30 May 2011
Accepted: 4 July 2011
Abstract
Aims. We investigate the production of molecular photofragments upon UV excitation of PAH derivatives, relevant for the interstellar medium.
Methods. The action absorption spectra of protonated gas-phase methyl-substituted quinolines (CH3 − C9H7NH+) have been recorded in the 215–338 nm spectral range using the electrostatic storage ring ELISA, an electrospray ion source and 3 ns UV laser pulses.
Results. It is shown that the absorption profile is both redshifted and broadened when moving the methyl group from the heterocycle containing nitrogen to the homoatomic ring. The absorption profiles are explained by TD-DFT calculations. The dissociation time of the studied molecules is found to be of several milliseconds at 230 nm and it is shown that after redistribution of the absorbed energy the molecules dissociate in several channels. The dissociation time found is an order of magnitude faster than the estimated IR relaxation time. Photophysical properties of both nitrogen containing and methyl-substituted PAHs are interesting in an astrophysical context in connection with identifying the aromatic component of the interstellar medium.
Key words: astrochemistry / molecular data / molecular processes / ultraviolet: ISM / ISM: molecules
© ESO, 2011
1. Introduction
Polycyclic aromatic hydrocarbons (PAHs) are recognized to be the carrier of the unidentified infrared emission bands (UIRs) now also known as the aromatic infrared bands (AIRs). These are observed in interstellar clouds irradiated by ultraviolet and optical photons (Allamandola et al. 1999). PAHs are believed to account for up to 30% of the carbon in the Milky Way (Snow & Witt 1995) and typically 20% of the carbon present in the interstellar medium (Tielens 2005). This large family of molecules (neutral and ionized) and their derivates (hydrogenated, dehydrogenated, substituted, and with side groups) are also believed to be a possible carrier of the diffuse interstellar bands (DIBs). The issue stands as an astrophysical mystery since the discovery of the DIBs in the 1920s.
Most of the UIR features are reproduced in laboratory spectroscopic studies of PAH cations (Tielens 2008). Of particular interest is a 6.2 μm band appearing at a lower wavelength than expected. In order to explain the shift of the 6.2 μm UIR band, nitrogen containing PAHs (PANHs) have therefore been studied both experimentally and theoretically (Bernstein et al. 2005; Hudgins et al. 2005; Mattioda et al. 2003; Mattioda et al. 2005; Alvaro Galué et al. 2010) and through astronomical observations (Peeters et al. 2002; Charnley et al. 2005) as nitrogen is the fourth most abundant molecule found in the interstellar medium. N and CH are isoelectronic and therefore substitution of a CH group with a nitrogen atom does not alter the conjugation of the molecule and facilitates protonation of the molecule. The interstellar medium is not the only environment where PANHs are believed to play an important role as they have also been found in meteorites (Stoks & Schwartz 1982; Sephton 2002) and in the atmosphere of the moon Titan (Ricca et al. 2001).
PAHs with side groups such as methyl, ethyl and amine have been found in meteorites and in interplanetary dust particles, and some of these PAHs are believed to be of interstellar origin (Clemett et al. 1993). A study by Langhoff et al. (1998) finds that adding a methyl or cyano side group does not alter the mid-IR emission spectrum of neither the neutral nor the cationic PAH, while an NH2-side group changes the charge destribution of the neutral molecule and thereby introduces cationic features in the spectrum. PAHs with side chains can contribute to the UIRs and cannot be excluded as components of the interstellar medium. Methyl was indeed detected in the interstellar medium in 2000 (Feuchtgruber et al. 2000) and methyl-substituted PAHs (Me-PAHs) are worth further consideration.
In this work the photostability of four gas-phase methyl-substituted quinolines are studied in their protonated form (CH3 − C9H7NH+), namely protonated 3-methylquinoline (3-MeQ), 4-methylquinoline (4-MeQ), 6-methylquinoline (6-MeQ) and 8-methylquinoline (8-MeQ) (Fig. 1). These are chosen to investigate the effect of a methyl sidegroup on the conjugation of the heterocycle (N containing) ring and the homocyclic ring. Methyl-substituted PAHs have previously been investigated (Salama et al. 1994; Cook et al. 1994; Langhoff et al. 1998; Bauschlicher et al. 1998; Husain et al. 2000; Useli-Bacchitta et al. 2010), but to the best of our knowledge methyl-substituted PANHs have not been studied previously.
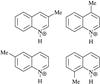 |
Fig. 1 Protonated methylquinolines. Upper row: 3-methylquinoline (3-MeQ) and 4-methylquinoline (4-MeQ). Lower row: 6-methylquinoline (6-MeQ) and 8-methylquinolines (8-MeQ). |
Until recently most laboratory results on PAHs were obtained by matrix isolation spectroscopy, which can only be used for neutral and cationic species (Tielens 2008). The radical cations are produced by ionisation by UV irradiation, but the technique is limited by the fact that, after UV irradiation, all the species contained in the matrix are not exactly known. By studying ionic species in gas-phase it is possible to mass select the ions and thereby overcome this problem. Other techniques such as cavity ring down spectroscopy (Romanini et al. 1999; Sukhorukov et al. 2004) and multiphoton dissociation spectroscopy (Useli-Bacchitta et al. 2010) have also provided important results on mass selected gas-phase molecules of astrophysical relevance.
Laboratory based absorption spectra are essential in order to identify particles in the interstellar medium. Direct light-attenuation measurements of absorption features of gas-phase molecules are difficult to obtain because of the low number of particles in experiments. Action spectroscopy is a powerful tool for investigation of the photophysics of gas-phase molecules as the technique does not measure an infinitesimal damping of the transmitted light but rather efficiently neutral fragments (action) created after excitation. The experimental set-up used in this study also gives information on the dissociation times. The action spectrum is recorded in the spectral region 215–338 nm and measurements of dissociation times and fragment masses are done at 230 nm.
2. Experiment
The experiments were performed at the electrostatic ion storage ring facility ELISA in Aarhus (see Fig. 2). The set-up has been described in detail elsewhere (Møller 1997; Andersen et al. 2004). Briefly, the protonated Me-Qs (Sigma Aldrich) from a MeOH and acetic acid solution were brought into gas-phase by an electrospray ion source. The ions were accumulated for 100 ms in a cylindrical trap and hereafter mass selected by a 90 degree bending magnet before injection into the storage ring. After storage for about 35 ms the ions were photoexcited by a 3 ns UV pulse generated by an EXSPLA NT320 laser in the 212–338 nm region.
Figure 3 shows the time evolution of neutrals produced in the storage ring either by collisions with residual gas or as a consequence of photoexcitation. The action absorption spectra were recorded by measuring the neutral fragments detected in the MCP detector as a function of wavelength. The dissociation is highly dominated by single photon excitation, as evident by the linear dependence between the laser pulse energy and the number of neutrals detected. The number of neutrals generated after photoexcitation is in this case  (1)where Nneutrals is the integral over time of laser induced neutral fragments, Nions the integrated number of ions in the ion bunch, σ(λ) the wavelength dependent action absorption cross section and Φ the photon flux. The photon flux can be found by measuring the mean laser pulse energy, Elaser, at a given wavelength, ∫Φdt ∝ Elaserλ. The action absorption cross section is given by
 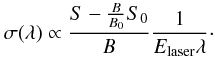 (2)Here S is the integrated number of neutral fragments caused by laser excitation (marked red in Fig. 3), B is the integrated background (green in Fig. 3) and S0 and B0 are the integrated counts in the same time windows without laser excitation of the ions. Nneutrals in (1) is given by
  . The number of ions in the ring cannot be measured but the integrated background B is proportional to Nions. The cross section obtained in this experiment is not absolute because the number of ions is not measured directly.
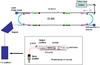 |
Fig. 2 The ELectrostatic Ion Storage ring in Aarhus, ELISA. For these experiments an electrospray ion source is used to produce the ions in gas-phase and a multichannel plate (MCP) detector is used to record the neutral fragments (action) produced in the storage ring. |
It is possible to store charged daughter fragments by switching the voltages of the electrostatic deflectors after photo excitation. Dumping these stored fragments on the MCP detector results in daughter mass spectroscopy. The resolution of this technique is very low (m/Δm ≈ 100), but for simple mass spectra and with some knowledge about the molecule it is a useful tool. For more details see Støchkel et al. (2008).
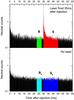 |
Fig. 3 Illustration of the applied technique. The figure shows recordings of neutral fragments produced in the storage ring. The upper and lower panels show a measurement of neutrals produced for 65 ms after injection of ions with and without photo excitation of the ions by a 3 ns duration laser pulse, fired 35 ms after the injection into the ring. The black areas are neutrals produced by collisions of the ions with residual gas in the ring. In the figure, green and cyan respectively indicate background window B and B0, and red and blue signal window S and S0 used in the calculation of the relative action absorption cross section. |
3. Calculations
For comparison with the experimental results, DFT and TD-DFT calculations were performed using the Gaussian 03 program (Frisch et al. 2004). Structure optimization, energy and excitation energies have been calculated at the B3LYP level of theory and using the 6-311+G(d, p) basis set. In the calculations both zero point corrections and scaling of the vibrational frequencies have been taken into account and all frequencies for the optimised structures have been checked and found possitive.
4. Results and discussion
4.1. Action spectra
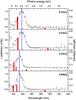 |
Fig. 4 Measured action spectra of the four methyl-substituted quinolines and the calculated electronic transition and their oscillator strengths. Gaussian profiles with centre at 232 nm (3-MeQ and 4-MeQ) and 238 nm (6-MeQ and 8-MeQ) and widths of 10.5 nm and 15 nm respectively, have been plotted together with the absorption profiles to indicate the spectral differences. It is clearly seen that the absorption profiles depend on the position of the methyl group. The red bars represent calculated oscillator strengths (right vertical axis). |
Figure 4 shows the action specta of the four methyl-substituted quinolines recorded in vacuum. The upper two panels show the spectra of 6-MeQ and 8-MeQ where the methyl group is placed on the ring not containing nitrogen while the lower panels show 4-MeQ and 3-MeQ where the methyl group is placed on the ring with nitrogen. The absorption maximum of 6-MeQ and 8-MeQ is at 238 nm (5.21 eV), while for 3-MeQ and 4-MeQ it is at 232 nm (5.35 eV). The absorption is hence shifted 0.14 eV by moving the methyl group from the ring not containing nitrogen to the ring with nitrogen. Note that in addition to the spectral shift the absorption is narrowed for 3-MeQ and 4-MeQ.
A difference of the electronic transitions is also seen in the TD-DFT calculations (red bars in Fig. 4). 3-MeQ and 4-MeQ have two relatively strong transitions in the 220–227 nm region, while 6-MeQ and 8-MeQ only have one strong transition near 229 nm. Even though the calculated transitions do not match the measured absorption maxima exactly, the redshifting trend is clearly seen. The calculations also indicates that the absorption feature seen experimentally cannot be ascribed to the S0 → S1 transition which is predicted to fall at 334–364 nm, but is a transition between the ground state and higher excited states S0 → Sn.
4.2. Fragmentation channels
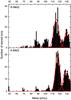 |
Fig. 5 Mass spectra of 4-MeQ (lower panel) and 6-MeQ (upper panel). Gaussian profiles have been plotted with centres at 117 and 129 amu for 4-MeQ and 115 and 129 amu for 6-MeQ. The main fragmentation channels are identified to be methyl loss and loss of a molecule containing two carbon atoms and a number of hydrogen atoms. |
The masses of the charged fragments produced by laser excitation are shown in Fig. 5. At 230 nm the most dominant channels are loss of methyl and a molecule containing two carbon atoms and a number of hydrogen atoms. Other channels are observed at lower masses but with much lower yield and will not be discussed further. The mass spectra are very similar for the two molecules, except that the dominant peak seems to be shifted from 117 amu to 115 amu (loss of C2Hn) from 4-MeQ to 6-MeQ. Because of the resolution of this method, it is not possible to measure the yield of loss of hydrogen (atomic and/or molecular) from the mother molecule nor distinguish between e.g. C2H2 and C2H3. The lowest energy channels are known to be H loss and C2H2 loss for small PAHs such as coronene and pyrene (Useli-Bacchitta et al. 2010).
Calculated adiabatic dissociation energies of 4-MeQ.
Table 1 gives the calculated dissociation energies of the expected fragmentation channels for 4-MeQ. As seen in the table the least expensive fragmenation channel is loss of a hydrogen atom on the methyl group, followed by loss of C2H3 from the heterocycle and C2H2 from the homocycle. Loss of the methyl group is less expensive than loss of hydrogen from the carbon atoms. The same results have been reported for non-nitrogen containing PAHs (Bauschlicher et al. 1998). Even though it is not possible to measure, hydrogen loss is an expected fragmentation channel due to the low adiabatic dissociation energy.
As mentioned we cannot distinguish between the loss of C2H2 and C2H3. The indole cation (C8H7N+) with mass 117 amu is stable and therefore a possible end product after dissociation. The adiabatic dissociation energy of 4-MeQ and C2H2+H from the homocycle is 5.71 eV while 4.71 eV for 4-MeQ and C2H3. Useli-Bacchitta et al. (2010) noted that loss of C2H2 is seen when excitation of the methyl-substituted pyrene cation takes place with photons in the visible spectral range. This channel has also been observed for non methyl-substituted PAHs when colliding with ions (Holm et al. 2010) and 7–35 eV photons (Gotkis et al. 1993; Jochims et al. 1994). To clarify which pathway is actually observed, transition-state calculations have been carried out for the loss of C2H3 and the lowest barrier is found to be 9.9 eV, whereas C2H2 loss from a homoatomic ring is known to have a barrier of only 4.6 eV (Dyakov et al. 2006).
4.3. Dissociation times
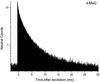 |
Fig. 6 Number of neutrals measured 0–30 ms after photo excitation by a 230 nm ns pulse of 4-MeQ. The number of neutral counts have been normalized to the height of the injection peak not shown in this figure. It is clearly seen that the dissociation time spans over several milliseconds. This is also seen for the other three methyl-substituted quinolines studied at ELISA. |
Figure 6 shows as example the decay of 4-MeQ after excitation at 230 nm. The decay is clearly statistical with a decay time of several milliseconds and hence energy is redistributed in the molecule before the decay. 4-MeQ does not have a simple exponential decay most likely due to the energy spread in the stored ions.
An Arrhenius model which takes the energy spread of the molecules into account has been applied to the data. The fit gives an activation energy of about 4.5 eV and a pre-exponential factor of 1028 s-1. The obtained activation energy is in relatively good agreement with the lowest dissociation energy of 4.41 eV (Table 1). The dissociation rate gives a lifetime of ~4–5 ms and is of the same order of magnitude as calculated by Dyakov et al. (2006). The two factors in the Arrhenius expression cannot be determined exactly as it requires time spectra at more wavelengths over the absorption feature. Based on the Einstein A-factor the radiative lifetime can be estimated from the frequency modes. The molecule is expected to decay radiatively with a lifetime of ~91 ms – an order of magnitude slower than the dissociation lifetime. The three other isotopes decay at the same time scale.
5. Conclusions
In this work the action absorption spectra of four methyl-substituted quinolines have been recorded in the gas-phase. The results show a redshift of 0.14 eV and clear broadening of the absorption profile when moving the methyl group from the heterocycle to the homocycle. TD-DFT calculations ascribe the main absorption to S0 → Sn with n ≠ 1 and show the same trend towards the red as the experimental data.
Many fragmentation channels are observed after photoexcitation at 230 nm. The main channels are loss of methyl and a molecule containing two carbon atoms and a number of hydrogen atoms. Adiabatic dissociation energies calculated for 4-MeQ using DFT also give loss of hydrogen atoms as a possible fragmentation channel, but the present technique cannot identify loss of masses less than 10% of the mass of the mother molecule. Loss of C2H2 from the homocycle, C2H3 from the heterocycle and CH3 all have an adiabatic dissociation energy smaller than the photon energy (5.40 eV). Transition state calculations of pathways of fragmentation of C2H3 from the heterocycle give an energy barrier of 9.9 eV, thus excluding this channel.
The dissociation time of 4-MeQ is several milliseconds and the decay is not a simple exponential. The three other molecules in this study have times of the same order of magnitude. Using the frequencies and IR intensities obtained from the DFT optimisation calculations, 4-MeQ is expected to decay radiatively with a lifetime of ~91 ms, which is an order of magnitude slower than the dissociation time.
This study shows that the fragmentation pattern of even small PAHs can be very complex and that fragmentation may happen faster than IR-emission of the absorbed energy through the vibrational modes. Absorption of an UV photon leads to creation of cations which then, in turn may emit excess energy as infrared photons. These molecules should also be taken into account when considering molecules and ions contributing to the infrared emission features of the interstellar medium. However, when much larger PAHs are considered, the temperature gain upon UV excitation becomes smaller and the dissociation probably of less importance.
Acknowledgments
This work has been supported by the Carlsberg Foundation, the Danish Research Agency and the Lundbeck Foundation. We thank A. Bochenkova, L. Hornekær, and Y. Toker for helpful discussions.
References
- Allamandola, L. J., Hudgins, D. M., & Sandford, S. A. 1999, ApJ, 511, L115 [NASA ADS] [CrossRef] [PubMed] [Google Scholar]
- Alvaro Galué, H., Pirali, O., & Oomens, J. 2010, A&A, 517, A15 [NASA ADS] [CrossRef] [EDP Sciences] [Google Scholar]
- Andersen, L. H., Bluhme, H., Boye, S., et al. 2004, Phys. Chem. Chem. Phys., 6, 2617 [CrossRef] [Google Scholar]
- Bauschlicher, C. W., Jr., & Langhoff, S. R. 1998, Chem. Phys., 234, 79 [NASA ADS] [CrossRef] [Google Scholar]
- Bernstein, M. P., Mattioda, A. L., Sandford, S. A., & Hudgins, D. M. 2005, ApJ, 626, 909 [NASA ADS] [CrossRef] [Google Scholar]
- Charnley, S. B., Kuan, Y., Huang, H., et al. 2005, Adv. Space Res., 36, 137 [NASA ADS] [CrossRef] [Google Scholar]
- Clemett, S. J., Maechling, C. R., Zare, R. N., Swan, P. D., & Walker, R. M. 1993, Science, 262, 721 [NASA ADS] [CrossRef] [PubMed] [Google Scholar]
- Cook, D. J., Schlemmer, S., Balucani, N., et al. 1994, Nature, 380, 227 [Google Scholar]
- Dyakov, Y. A., Ni, C.-K., Lin, S. H., Lee, Y. T., & Mebel, A. M. 2006, Phys. Chem. Chem. Phys., 8, 1404 [CrossRef] [PubMed] [Google Scholar]
- Feuchtgruber, H., Helmich, F. P., van Dishoeck, E. F., & Wright, C. M. 2000, ApJ, 535, L111 [Google Scholar]
- Frisch, M. J., Trucks, G. W., Schlegel, H. B., et al. 2004, Gaussian 03, Revision C.02, Gaussian, Inc., Wallingford, CT [Google Scholar]
- Gotkis, Y., Oleinikova, M., Naor, M., & Lifshitz, C. 1993, J. Phys. Chem., 97, 12282 [CrossRef] [Google Scholar]
- Holm, A. I. S., Zettergren, H., Johansson, H. A. B., et al. 2010, Phys. Rev. Lett., 105, 213401 [NASA ADS] [CrossRef] [PubMed] [Google Scholar]
- Hudgins, D. M., Bauschlicher, C. W., Jr., & Allamandola, L. J. 2005, ApJ, 632, 316 [NASA ADS] [CrossRef] [EDP Sciences] [Google Scholar]
- Husain, M. M., Khan, M. S., & Khan, Z. H. 2000, Spectrochimica Acta Part A: Molecular and Biomolecular Spectroscopy, 56, 2741 [NASA ADS] [CrossRef] [Google Scholar]
- Jochims, H. W., Ruhl, E., Baumgartel, H., Tobita, S., & Leach, S. 1994, ApJ, 420, 307 [NASA ADS] [CrossRef] [Google Scholar]
- Langhoff, S. R., Bauschlicher, C. W., Hudgins, D. M., Sandford, S. A., & Allamandola, L. J. 1998, J. Phys. Chem. A, 102, 1632 [CrossRef] [PubMed] [Google Scholar]
- Mattioda, A. L., Hudgins, D. M., Bauschlicher, C. W., Rosi, M., & Allamandola, L. J. 2003, J. Phys. Chem. A, 107, 1486 [CrossRef] [Google Scholar]
- Mattioda, A. L., Hudgins, D. M., Bauschlicher, C. W., & Allamandola, L. J. 2005, Adv. Space Res., 36, 156 [NASA ADS] [CrossRef] [Google Scholar]
- Møller, S. P. 1997, Nuclear Instruments and Methods in Physics Research Section A: Accelerators, Spectrometers, Detectors and Associated Equipment, 394, 281 [Google Scholar]
- Peeters, E., Hony, S., Van Kerckhoven, C., et al. 2002, A&A, 390, 1089 [NASA ADS] [CrossRef] [EDP Sciences] [Google Scholar]
- Ricca, A., Bauschlicher, C. W., & Bakes, E. L. O. 2001, Icarus, 154, 516 [NASA ADS] [CrossRef] [Google Scholar]
- Romanini, D., Biennier, L., Salama, F., et al. 1999, Chem. Phys. Lett., 303, 165 [NASA ADS] [CrossRef] [PubMed] [Google Scholar]
- Salama, F., Joblin, C., & Allamandola, L. J. 1994, J. Chem. Phys, 101, 10252 [Google Scholar]
- Sephton, M. A. 2002, ChemInform, 33, 262 [Google Scholar]
- Snow, T. P., & Witt, A. N. 1995, Science, 270, 1455 [NASA ADS] [CrossRef] [PubMed] [Google Scholar]
- Støchkel, K., Kadhane, U., Andersen, J. U., et al. 2008, Rev. Sci. Instrum., 79, 023107 [Google Scholar]
- Stoks, P. G., & Schwartz, A. W. 1982, Geochim. Cosmochim. Acta, 46, 309 [NASA ADS] [CrossRef] [Google Scholar]
- Sukhorukov, O., Staicu, A., Diegel, E., et al. 2004, Chem. Phys. Lett., 3860, 259 [NASA ADS] [CrossRef] [Google Scholar]
- Tielens, A. G. G. M. 2005, The Physics and Chemistry of the Interstellar Medium, ed. A. G. G. M. Tielens [Google Scholar]
- Tielens, A. G. G. M. 2008, ARA&A, 46, 289 [NASA ADS] [CrossRef] [EDP Sciences] [Google Scholar]
- Useli-Bacchitta, F., Bonnamy, A., Mulas, G., et al. 2010, Chem. Phys., 371, 16 [NASA ADS] [CrossRef] [Google Scholar]
All Tables
All Figures
|
Fig. 1 Protonated methylquinolines. Upper row: 3-methylquinoline (3-MeQ) and 4-methylquinoline (4-MeQ). Lower row: 6-methylquinoline (6-MeQ) and 8-methylquinolines (8-MeQ). |
| In the text | |
|
Fig. 2 The ELectrostatic Ion Storage ring in Aarhus, ELISA. For these experiments an electrospray ion source is used to produce the ions in gas-phase and a multichannel plate (MCP) detector is used to record the neutral fragments (action) produced in the storage ring. |
| In the text | |
|
Fig. 3 Illustration of the applied technique. The figure shows recordings of neutral fragments produced in the storage ring. The upper and lower panels show a measurement of neutrals produced for 65 ms after injection of ions with and without photo excitation of the ions by a 3 ns duration laser pulse, fired 35 ms after the injection into the ring. The black areas are neutrals produced by collisions of the ions with residual gas in the ring. In the figure, green and cyan respectively indicate background window B and B0, and red and blue signal window S and S0 used in the calculation of the relative action absorption cross section. |
| In the text | |
|
Fig. 4 Measured action spectra of the four methyl-substituted quinolines and the calculated electronic transition and their oscillator strengths. Gaussian profiles with centre at 232 nm (3-MeQ and 4-MeQ) and 238 nm (6-MeQ and 8-MeQ) and widths of 10.5 nm and 15 nm respectively, have been plotted together with the absorption profiles to indicate the spectral differences. It is clearly seen that the absorption profiles depend on the position of the methyl group. The red bars represent calculated oscillator strengths (right vertical axis). |
| In the text | |
|
Fig. 5 Mass spectra of 4-MeQ (lower panel) and 6-MeQ (upper panel). Gaussian profiles have been plotted with centres at 117 and 129 amu for 4-MeQ and 115 and 129 amu for 6-MeQ. The main fragmentation channels are identified to be methyl loss and loss of a molecule containing two carbon atoms and a number of hydrogen atoms. |
| In the text | |
|
Fig. 6 Number of neutrals measured 0–30 ms after photo excitation by a 230 nm ns pulse of 4-MeQ. The number of neutral counts have been normalized to the height of the injection peak not shown in this figure. It is clearly seen that the dissociation time spans over several milliseconds. This is also seen for the other three methyl-substituted quinolines studied at ELISA. |
| In the text | |
Current usage metrics show cumulative count of Article Views (full-text article views including HTML views, PDF and ePub downloads, according to the available data) and Abstracts Views on Vision4Press platform.
Data correspond to usage on the plateform after 2015. The current usage metrics is available 48-96 hours after online publication and is updated daily on week days.
Initial download of the metrics may take a while.