| Issue |
A&A
Volume 674, June 2023
|
|
|---|---|---|
| Article Number | A103 | |
| Number of page(s) | 18 | |
| Section | Atomic, molecular, and nuclear data | |
| DOI | https://doi.org/10.1051/0004-6361/202346003 | |
| Published online | 08 June 2023 | |
Gas-phase electronic action absorption spectra of protonated oxygen-functionalized polycyclic aromatic hydrocarbons (OPAHs)★
1
Department of Physics and Astronomy, Aarhus University,
Ny Munkegade 120,
8000
Aarhus C, Denmark
2
Center for Interstellar Catalysis (InterCat), Department of Physics and Astronomy, Aarhus University,
Ny Munkegade 120,
8000
Aarhus C, Denmark
3
Department of Chemistry, Massachusetts Institute of Technology,
77 Massachusetts Avenue,
Cambridge, MA
02139, USA
e-mail: This email address is being protected from spambots. You need JavaScript enabled to view it.
4
Interdisciplinary Nano-Science Centre (iNano), Aarhus University,
Gustav Wieds Vej 14,
8000
Aarhus C, Denmark
Received:
26
January
2023
Accepted:
10
April
2023
Abstract
Context. Extended red emission (ERE) denotes a broad unassigned feature extending from 540 to 800 nm observed in many regions of the interstellar medium (ISM), and is thought to originate from photoluminescence of cosmic dust. However, definitive assignment of specific carriers remains to be achieved.
Aims. Our aim is to investigate the photoabsorption spectra of astrophysically relevant protonated oxygen-functionalized polycyclic aromatic hydrocarbons (OPAHs) to probe their ability to absorb photons in the near-ultraviolet (UV) and visible (vis) spectral region and to search for any low-lying electronic states that may account for the ERE.
Methods. Gas-phase electronic action absorption spectra of the protonated OPAHs were recorded in the spectral range of 200–700 nm using the ELISA ion-storage ring. Additional time-dependent density functional theory (TD-DFT) calculations were performed to compute excited state transitions that complement the experimental spectra.
Results. A set of five protonated (O)PAHs was considered, namely pentacene and the four oxygen-functionalized PAHs, pentacenequinone, pentacenetetrone, anthraquinone, and phenathrenequinone. All pentacene-related species show a main absorption band between 400 and 500 nm, while the smaller OPAHs, anthraquinone and phenanthrenequinone, generally absorb further to the blue compared to the pentacenes. Interestingly, pentacenequinone and phenanthrenequinone exhibit wide absorption plateaus towards the red side of their main absorption band(s), which places them among the potential candidates to contribute to ERE. Additional photodissociation mass spectra reveal the formation of smaller functionalized PAHs and small oxygen-bearing species.
Conclusions. Our results demonstrate the ability of OPAHs to absorb in the UV/vis spectral region. Among the four studied OPAHs, two revealed very broad absorption characteristics at wavelengths up to 700 nm, which makes them suitable candidates to contribute to a part of the ERE spectrum. Moreover, these two OPAHs, pentacenequinone and phenanthrenequinone, could dissociate efficiently into oxygen-bearing molecules and smaller functionalized PAHs in photon-dominated regions (PDRs) of the ISM.
Key words: astrochemistry / molecular data / ISM: molecules / dust, extinction / methods: laboratory: molecular / techniques: spectroscopic
The dataset associated with this work can be found under https://doi.org/10.5281/zenodo.7425438
© The Authors 2023
 Open Access article, published by EDP Sciences, under the terms of the Creative Commons Attribution License (https://creativecommons.org/licenses/by/4.0), which permits unrestricted use, distribution, and reproduction in any medium, provided the original work is properly cited.
This article is published in open access under the Subscribe to Open model. This email address is being protected from spambots. You need JavaScript enabled to view it. to support open access publication.
1 Introduction
Polycyclic aromatic hydrocarbons (PAHs) are ubiquitous species in the interstellar medium (ISM) accounting for about 10–20% of the cosmic carbon content (see Tielens 2008, for a review). Their presence in space has been long predicted by the PAH model (Léger & Puget 1984; Allamandola et al. 1985) and the first four PAHs have recently been detected in the Taurus molecular cloud TMC-1; namely the pure PAH indene (Burkhardt et al. 2021; Cernicharo et al. 2021) and the N-bearing species 1- and 2-cyanonaphthalene (McGuire et al. 2021), and 2-cyanoindene (Sita et al. 2022).
The original PAH model had been proposed to explain the characteristic features in the infrared (IR) emission from hot gas and dust that gives rise to the unidentified infrared emission (UIE) bands observed in many astronomical objects (Peeters et al. 2002). In those regions, isolated cosmic PAHs are photo-processed by the interaction with the interstellar radiation field, including visible (vis) and ultraviolet (UV) light (Jones 2009; Joblin et al. 2020). Upon absorption of a sufficiently energetic photon, PAHs can undergo different relaxation processes, that is, ionization, dissociation, and radiative cooling through IR emission that resulted in renaming the UIE bands to aromatic infrared bands (AIBs; Peeters et al. 2002). The strongest features are observed in the mid-IR (MIR) at 3.3, 6.2, 7.7, 8.6, 11.2, and 12.7 μm and are associated with the vibrational modes of PAHs.
Analyzing the AIB spectra gives constraints on the composition of the astrophysical population of PAHs (see Peeters 2011, for a review). For instance, the presence of N heteroatoms (PANHs), methylene-functionalized PAHs, and protonated PAHs were proposed to account for the position of the 6.2 μm band (Hudgins et al. 2005; Ricca et al. 2011; Wenzel et al. 2022). Very large compact PAHs were proposed to be the carriers of the 8.6 μm band (Bauschlicher et al. 2009). The 3.4 μm satellite band of the 3.3 μm aromatic C-H stretch band was attributed to aliphatic C–H vibrations from PAHs containing methyl side groups (Joblin et al. 1996) or superhydrogenated PAHs (Wagner et al. 2000; Sandford et al. 2013). Finally, the 6.0 μm satellite band to the 6.2 μm emission feature was specifically assigned to a C=0 stretch of a carbonyl group (Peeters et al. 2002). The potential impact of substituted aromatics on the AIBs is supported by a density functional theory (DFT) study that showed that the strong 11.2 μm feature was better fitted when oxygen- and/or magnesium-containing PAHs were included in the sample set (Sadjadi et al. 2015).
Relaxation through the emission of IR photons is not the only possible radiative cooling channel. Depending on the electronic structure of the considered PAH or PAH ion, fluorescence and recurrent fluorescence (RF), also known as Poincaré fluorescence, represent additional relaxation mechanisms (Léger et al. 1988; Boissel et al. 1997). In particular, RF occurs for molecular ions that possess strongly coupled low-lying electronic states that facilitate a redistribution of the absorbed energy through inverse internal conversion. The electronic transition to the ground state results in fluorescence and has been demonstrated to be a relevant process in the radiative cooling of hot PAH cations in dedicated electrostatic ion-storage ring experiments such as the Mini-Ring (Martin et al. 2013) and DESIREE (Zhu et al. 2022).
A widespread unassigned feature in astronomical observations of, for instance, the Red Rectangle, is called extended red emission (ERE) and spans, depending on the observed object, from 540 to 750 nm (Witt & Lai 2020), and in some cases extends with a red tail well beyond 850 nm (Lai et al. 2017). ERE is attributed to photoluminescence of dust grains and it was proposed that, among others, direct fluorescence from graphene oxide nanoparticles (Sarre 2019) or RF from PAH cations (Witt & Lai 2020) is the origin of ERE and that these species are therefore a significant component of cosmic dust. To account for the observed oxygen depletion in the diffuse ISM, Jones & Ysard (2019) propose the incorporation of oxygen into cosmic dust and conclude that the formation of carbonyl group-containing dust is possible. This is supported by IR observations and specifically features in the 5.6–6.0 μm region (Dartois et al. 2004; Dartois & Muñoz-Caro 2007; Jones 2016).
In search of possible carriers of the diffuse interstellar bands (DIBs, see Geballe 2016, for a review), protonated PAHs and PANHs have been considered (Hammonds et al. 2009, 2021; Noble et al. 2015). The former authors have shown that the electronic spectra of protonated and hydrogenated PAHs differ drastically compared to their neutral parents due to the fact that some of the electronic transitions of protonated PAHs fall in the visible region of the spectrum, especially in the 600–800 nm spectral region, coinciding with ERE.
Here we explore the role of protonated oxygen-functionalized PAHs (OPAHs) as potential contributors to the ERE. Possible formation routes of OPAHs in the ISM have been experimentally explored. OPAH formation was found to be efficient when PAHs are embedded in amorphous water ice covering interstellar dust grains and irradiated with UV light (Cook et al. 2015; Materese et al. 2015; Noble et al. 2020). Oxygen-containing aromatics have been detected in the Orgueil and Murchison meteorites (Sephton 2013) and specifically oxygen-containing PAHs were found in a range of carbonaceous chondrites (Slavicinska et al. 2022). Protonated (O)PAHs and their electronic spectra have previously been studied in Ne matrices (Garkusha et al. 2011; Chakraborty et al. 2015), but gas-phase studies are needed to evaluate their physico-chemical role in the ISM.
In the present study, we aim to test the ability of protonated OPAHs to contribute to the ERE by experimentally investigating their low-lying electronic states by means of gas-phase UV/vis action absorption spectroscopy. We present here the action absorption spectra of protonated pentacene, [C22H14]H+, its oxygen-functionalized derivatives 6,13-pentacenequinone (PQ), [C22H12O2]H+, and 5,7,12,14-pentacenetetrone (PT), [C22H10O4]H+; together with 5,9-anthraquinone (ANQ), [C14H8O2]H+, and its isomer 9,10-phenanthrenequinone (PHQ), [C14H8O2]H+ (see Fig. 1 for their molecular structures), by detecting their neutral photo-fragments as a function of laser wavelength over the range of 200–700 nm.
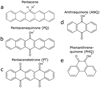 |
Fig. 1 Molecular structures of protonated (a) pentacene (279 amu), (b) 6,13-pentacenequinone (309 amu), (c) 5,7,12,14-pentacenetetrone (339 amu), (d) 5,9-anthraquinone (209 amu), and (e) 9,10-phenanthrenequinone (209 amu). |
2 Methods
The experiments were performed at the ELISA ion-storage ring, which has been described in detail before (Møller 1997; Andersen et al. 2004; Rasmussen et al. 2021). Briefly, the molecules of interest were dissolved in a mixture of methanol and toluene. A small amount of acetic acid was added as a proton donor. The ratio of the solvents was optimized for best ion signal for each sample. The molecules were protonated and brought into gas-phase using an electrospray ionization (ESI) source (see Fig. 2a). The ions were accumulated and thermalized in a 22-pole radio frequency ion trap injected with helium buffer-gas and subsequently accelerated to 22 keV. A magnet was used to mass-to-charge select the ions of interest before entering the ring. The ions were stored in the ring for several milliseconds at a pressure of approximately 1 × 10⁻¹⁰ mbar. Neutral fragments due to collisions with the residual gas were detected at the end of each of the straight sections of the ring by a secondary-electron detector (SED) and a microchannel plate (MCP) detector (see Fig. 2b). The SED consists of an indium-tin-oxide coated glass plate which emits electrons when neutrals collide with the glass plate. The electrons are then accelerated into a channeltron detector. After circulating for 5–10 ms, the ion bunch was irradiated by a ns-laser pulse (EKSPLA NT-232-50-SH/SFG laser system) in the interaction region of the ring. The laser induced neutral fragments are collected independently on both detectors and the neutral fragment count is proportional to the action absorption cross section (see Appendix A for details). All measurements were performed at room temperature. The neutral PAH samples are commercially available from Sigma-Aldrich (SA, pentacene) and Tokyo Chemical Industry (TCI, all other samples) and were used without any further purification. Their purities as detailed by the vendors are reported in Table 1.
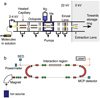 |
Fig. 2 Schematic view of the experimental setup, (a) Electrosprayionization source (ESI), (b) The ELISA ion-storage ring. Ions are irradiated in the interaction region and neutral fragments are recorded by the SED and MCP detector. |
Neutral PAH samples and their purities as used in this work.
3 Results and discussion
3.1 Action absorption spectra
We present the action absorption spectra of protonated pentacene and the four protonated OPAHs in Fig. 3. The action absorption spectra were recorded by measuring the neutral fragments produced after laser irradiation. The neutral fragment counts collected by the SED as a function of time after injection into the ring are shown for all studied species in Fig. 4. During each revolution in the ring (60–75 μs), some ions dissociate due to collisions with the residual gas and those dissociating in the straight sections produce a signal on the following detector. After laser irradiation (marked with an arrow on Fig. 4) the number of neutrals detected increases significantly. These laser induced fragments are our action signal. The fragmentation of pentacene and PT occurs within 20 μs (Figs. 4a,c), while the fragmentation of PQ, ANQ, and PHQ occurs over a slower time scale of up to 1 ms. The rate of fragmentation depends on the energy absorbed and the activation energy of the relevant fragmentation channel(s). Fragments produced within a few microseconds of laser irradiation were recorded by the SED, while fragments produced by slower statistical fragmentation were recorded by the MCP detector. Due to the fact that the SED is placed in the line-of-sight of the laser and that its glass plate absorbs photons below 350 nm (above 3.5 eV), fragmentation can only be detected by the MCP detector in this wavelength range. Therefore, all spectra reported below 350 nm in Fig. 3 have only been recorded with the MCP detector.
The action absorption spectra of the three pentacene-derived species are depicted in Figs. 3a–c and present each one main absorption band in the 400–500 nm region with indications of one additional band located towards the blue. Due to the fast dissociation of both pentacene and PT within 20 μs after laser irradiation (see Figs. 4a,c), it was not possible to measure their absorption action spectra at shorter wavelengths. The main observed absorption band of protonated pentacene, PQ, and PT, is centered around 470, 490, and 420 nm, respectively. PQ shows another less intense band in the blue at around 340 nm and, interestingly, a long plateau extending towards the red from about 550 to 650 nm.
Figures 3d,e show the action absorption spectra of the smaller protonated OPAH isomers, ANQ and PHQ, respectively. Generally, their absorption bands are blue-shifted compared to the pentacene-derived species. ANQ presents two main absorption bands at around 225 and 370 nm. The fragmentation in the 370 nm band is due to absorption of multiple photons and as the photon energy increases the fragmentation occurs faster and is only detected by the SED. The dashed vertical line in Fig. 3d indicates the cutoff for detection by the SED (above 350 nm) to where the MCP detector was used (below 350 nm). PHQ has an absorption band at around 330 nm with shoulders both to the red and to the blue. The shoulder to the red is more pronounced and located at around 370 nm. This is a real feature of PHQ, as we can exclude contamination from ANQ, which could possibly be created by isomerization during the electrospray process, due to the fact that no absorption is observed at 225 nm, where ANQ absorbs strongly. Similarly to PQ, PHQ exhibits a long absorption tail extending to the red until 700 nm. The tail consists of two low-absorption plateaus, one from 400–440 nm and a second from approximately 540–650 nm, connected via a negative slope. The insert in Fig. 3e depicts this second plateau of low absorption from 500–700 nm.
All (O)PAHs considered in this work are species with a high heat capacity, and accordingly not easily fragmented. For fragmentation to occur, each protonated species was found to require absorption of multiple photons as revealed by laser power-dependent measurements (see Appendix Β for details). It is therefore possible that there are further absorption bands at longer wavelengths which cannot be observed in our action absorption spectroscopy approach because absorption of many lower-energy photons is required in order to dissociate the species.
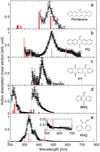 |
Fig. 3 Action absorption spectra of protonated (a) pentacene, (b) pentacenequinone, (c) pentacenetetrone, (d) anthraquinone, and (e) phenanthrenequinone. The errorbars are calculated by propagation of error and are due to counting statistics and laser energy variation. The black lines are smoothing lines to guide the eye. The red bars indicate calculated excited state transitions (S0 → Sn) computed at the CAM-B3LYP/def2TZVP level of theory. The height of the bars corresponds to the oscillator strength. The calculated excitation energies for protonated (b) pentacenequinone and (e) phenanthrenequinone are redshifted to fit the experimental data by 0.5 and 1.5 eV, respectively. |
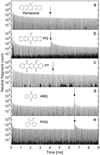 |
Fig. 4 Histograms of the neutral fragments counted by the SED as a function of storage time in the ring for protonated (a) pentacene, (b) pentacenequinone, (c) pentacenetetrone, (d) anthraquinone, and (e) phenanthrenequinone. The arrows indicate when the laser was fired. Note the logarithmic y-scale. |
3.2 Comparison to calculated excited state transitions
In order to compare the experimental action absorption spectra to theoretical calculations, we computed the first 10 excited states of the five protonated (O)PAH samples using time-dependent density functional theory (TD-DFT) at the CAM-B3LYP/def2TZVP (Yanai et al. 2004; Weigend & Ahlrichs 2005) level of theory using the Gaussian 16 program package (Frisch et al. 2016). Prior to that, the geometries of each protonated (O)PAH were optimized using DFT at the B3LYP/6-311++G(d,p) (Becke 1993) level of theory. The calculated excited state transitions are listed in Table C.1 and depicted in Figs. 3a–e as vertical red bars for each of the species with their height representing the corresponding oscillator strength.
In the cases of protonated pentacene, PT, and ANQ, the calculated electronic transitions are in good agreement with our experimentally measured action absorption spectra. All calculated transitions with sufficient oscillator strength to be visible in Figs. 3a,c,d are located in the same ranges as the recorded experimental spectra. The first two calculated excited state transitions of protonated pentacene at 520.10 and 481.12 nm correspond well with the observed absorption band centered around 470 nm, while the third and strongest excited state transition at 400.75 nm fits with the indication of an additional band towards the blue. In the case of protonated PT, the first two calculated excited state transitions at 467.49 and 446.77 nm have an oscillator strength of 0 and are therefore not depicted in Fig. 3c, while the third transition at 419.60 nm matches well with the observed main absorption band. For ANQ, the main absorption bands can be explained with blending of the excited state transitions. While the first transition has an oscillator strength of 0, jointly considering the second to fourth excited state transitions at 400.44, 363.51, and 344.15 nm, respectively, is in excellent agreement with the measured absorption band around 370 nm. This is also true for the absorption band at 225 nm, whose shoulders seem to be captured well by the fifth to tenth theoretically calculated excited state transitions.
The situation is different for two of the studied quinone species, namely protonated PQ and PHQ. For our calculations of the excited state transitions to match the experimentally recorded action absorption spectra, the energies of the calculated transitions were redshifted by 0.5 eV and 1.5 eV for protonated PQ and PHQ, respectively (see Figs. 3b,e). We therefore abstain from a thorough discussion comparing absorption band and calculated electronic transition positions. We would like to note, however, that qualitatively speaking the experimental action absorption band can be well explained after redshifting the theoretical transitions. Interestingly, the two quinone species, protonated PQ and PHQ, for which the calculated energies had to be shifted significantly to fit the measured data, are also the two species which exhibit the long red absorption tails including the extended flat plateaus that we discussed in Sect. 3.1. According to the calculated and redshifted excited state transition energies and oscillator strengths, only a single electronic transition is responsible for each of the plateaus observed for both protonated PQ and PHQ.
The excitation energies were calculated using different functional and basis set combinations (see Appendix C for details). The choice of basis set made no significant difference to the calculated excitation energies. The long-range corrected functionals (CAM-B3LYP, Weigend & Ahlrichs 2005; LC-ωHPBE, Henderson et al. 2009; and ωB97XD, Chai & Head-Gordon 2008) performed better than the global hybrid functionals (B3LYP, Becke 1993; and MN 15, Yu et al. 2016). Many of the excitations show charge transfer characteristic, which is handled better by long-range corrected functionals than global functions, which tend to underestimate them (Peach et al. 2008). The long-range corrected functionals tended to overestimate the excitation energies, especially for the case of protonated PQ and PHQ. Overestimation of the excited energies by TD-DFT has been observed before for states presenting double-excitation nature (Zhou 2018; Helal et al. 2022).
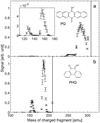 |
Fig. 5 Mass spectra of positively charged fragments produced by laser irradiation of protonated (a) pentacenequinone at 490 nm and (b) phenanthrenequinone at 420 nm. The vertical lines indicate the parent mass. |
3.3 Daughter-mass spectrometry
Using the electrostatic deflectors of ELISA as mass-analyzers, a low-resolution mass spectrum of the charged fragments produced by laser irradiation can be recorded. Such mass spectra are reported for protonated PQ and PHQ in Fig. 5, where PQ and PHQ were irradiated with the laser tuned to 490 and 420 nm, respectively. The wavelength was chosen such that the total number of neutral fragments was maximized. For PQ, this coincided with the main absorption band, while for PHQ the maximum number of neutral fragments was produced at 420 nm, where the laser power was higher.
Both protonated PQ and PHQ show a similar fragmentation behavior with two main dissociation channels, located for PQ at (283 ± 2) and (257 ± 2) amu, and for PHQ at (186 ± 2) and (156 ± 2) amu, which is in excellent agreement with previously measured electron impact ionization mass spectra (NIST Mass Spectrometry Data Center & William E. Wallace 2023; Jaganathan et al. 2022). We measured two additional, less intense, dissociation channels for PQ at (156 ± 2) and (128 ± 2) amu (see insert in Fig. 5a).
These two main charged fragments at (283 ± 2) and (257 ± 2) amu for PQ, and at (186 ± 2) and (156 ± 2) amu for PHQ, are likely produced due to a mixture of (subsequent) loss of CO, COHn, and/or C2H4±n species. We were able to record two additional dissociation channels in the case of protonated PQ. A likely scenario is the loss of CO, COHn, or C2H4±n from protonated PQ in a first step resulting in the (283 ± 2) amu fragment. This is followed by further fragmentation into one of the three additional channels via either loss of an additional CO, COHn, or C2H4±n resulting in the (257 ± 2) amu channel or breaking apart resulting in two fragments that are similar in size, for example the smaller two-carbon ring aromatics naphthalene (128 amu) and naphtaldehyde, ethylnaphthalene, or dimethyl-naphthalene (all three species have a mass of 156 amu). These results are consistent with imaging photoelectron photoion coincidence (iPEPICO) spectroscopy experiments investigating the dissociative photoionization of the OPAH benzofuran (Zinck et al. 2022) and of hydroxy-substituted PAH cations (Lesniak et al. 2019) that revealed their primary dissociation channel to be CO- and HCO-loss.
4 Conclusions
In this work the electronic photoabsorption properties of protonated pentacene and four protonated OPAHs were studied in the gas-phase. Action absorption spectra were recorded employing the ELISA ion-storage ring. The presented results demonstrate that protonated pentacene, PQ, and PT have a main absorption band in the 400–500 nm range, while the absorption of the smaller protonated OPAHs, ANQ and PHQ, are generally blueshifted compared to the pentacene-derived species. The action absorption spectra of protonated PQ and PHQ show broad absorption plateaus towards the red side of the main absorption band, which can be explained by low-lying electronic states that might be relevant for the explanation of the broad ERE.
To investigate the low-lying electronic states further, measurements at cryogenic temperatures relevant for the ISM could reveal narrower absorption bands that might be more comparable to theoretically calculated excited state transitions. Larger OPAHs than the here studied pentacene-derived species are expected to possess absorption bands that are comparably shifted to the red and might therefore be promising candidates to test for low-lying electronic states. We note, that these larger OPAHs also have a higher heat capacity and will therefore be difficult to fragment.
We found that, upon absorption of multiple photons, the protonated pentacene and PT dissociate on a short timescale, within 20 μs, whereas PQ, ANQ, and PHQ show delayed statistical dissociation over about a millisecond. Daughter-mass spectrometry performed for protonated PQ and PHQ revealed that the dissociation of these species followed a similar pattern. Indeed, the loss of about 28 and 56 amu corresponding to the (subsequent) loss of either CO, COHn, and/or C2H4±n species were the main dissociation channels observed for both PQ and PHQ, which is consistent with previous measurements. Another family of photoproducts found in this study are the smaller naphthalene-related species, substituted with either two methyl, an ethyl, or an aldehyde functional group.
This study has demonstrated the potential of OPAHs to contribute to the ERE when illuminated by UV/vis radiation. We additionally showed that OPAHs posses the ability to photodissociate into oxygen-bearing molecules and other smaller functionalized species. These findings suggest that OPAHs could play an important role in interstellar chemistry and in photondominated regions (PDRs) of the ISM.
Acknowledgements
This work has been supported by the Danish National Research Foundation through the Center of Excellence “InterCat” (Grant Agreement no.: DNRF150).
Appendix A Action absorption spectroscopy
The action absorption cross section is determined as
 (A.1)
(A.1)
where λ is the wavelength of the laser light, ΝΑ(λ) is the number of neutral fragment counts in the signal window when the laser is on (see Fig. A.1),  is the number of neutral fragment counts in the signal window when the laser is off, ΝΒ(λ) is the number of neutral fragment counts in the background window when the laser is on,
  is the number of neutral fragment counts in the background window when the laser is off, and Epulse(λ) is the laser-pulse energy measured at each wavelength. An action absorption spectrum is created by measuring the number of neutral fragments while scanning the laser wavelength.
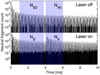 |
Fig. A.1 Counts as a function of storage time in the ring. Time windows used for data analysis are highlighted in blue. The example is pentacenequinone irradiated by laser pulses in the range 400-500 nm fired after approximately 4 ms of storage time measured on the MCP detector. Note the logarithmic scale. |
Appendix B Photon dependence
Measurements of the neutral fragment counts as a function of laser-pulse energy were used to determine the number of photons needed for fragmentation for each PAH sample. After absorption of a single photon, the internal conversion of electronic energy into vibrational degrees of freedom happens on a ps timescale, which is short compared to the time duration of the laser pulse, which is several ns. Therefore, the molecule can absorb several photons from a single laser pulse, with the number being limited by the flux of photons the molecule is exposed to and the cross section of the absorption. The fragmentation yield depends on the number of photons as;
![Mathematical equation: ${N_{{\rm{neutrals}}}} \propto {N_{{\rm{ions}}}}{\left[ {\sigma \left( \lambda \right){N_{{\rm{photons}}}}\left( \lambda \right)} \right]^n},$](/articles/aa/full_html/2023/06/aa46003-23/aa46003-23-eq4.png) (B.1)
(B.1)
where σ(λ) is the absorption cross section and n is the number of photons absorbed per molecule. Depletion of the ion beam can cause the signal to saturate. Figure B.1 shows the fragmentation signal as a function of laser-pulse energy for the protonated pentacene and the four protonated OPAHs. All species are found to fragment after absorption of at least two photons. Depletion sets in for the protonated pentacenequinone, anthraquinone, and phenanthrenequinone at higher laser power. This is observable with the MCP detector, while no depletion is observable on the prompt SED (see Fig. B.1b,d,e). This suggests that the fragmentation is indeed due to absorption of multiple photons. As the number of available photons increases, the likelihood that two or more photons are absorbed increases, which moves the fragmentation to the prompt detector (SED). The signal on the SED seems linear due to a competition between multiple photon absorption and depletion of the ion bunch. When measuring the action absorption spectra, the laser power was set to below saturation.
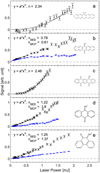 |
Fig. B.1 Fragmentation yield as a function of laser power shows the photon dependences of the signal for protonated a) pentacene, b) pen-tacenequinone, c) pentacenetetrone, d) anthraquinone, and e) phenanthrenequinone. The black dots are recorded with the SED, while the blue dots are recorded by the MCP detector. |
Appendix C Calculated excitation energies
In the following, we report the calculated excited state transitions computed using different functional and basis set combinations as implemented in Gaussian16. All molecular geometries were optimized at the B3LYP/6-311++G(d,p) level of theory.
Appendix C.1 CAM-B3LYP functional
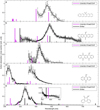 |
Fig. C.1 Action absorption spectra of protonated a) pentacene, b) pentacenequinone, c) pentacenetetrone, d) anthraquinone, and e) phenanthrenequinone. The black lines are smoothing lines to guide the eye. The colored bars indicate calculated excited state transitions (S0 → Sn) computed with the CAM-B3LYP functional combined with the def2TZVP basis set. The height of the bars represent the oscillator strengths. The black vertical bars are the calculated excitation energies redshifted in energy by 0.5 eV for pentacenequinone (b) and 1.5 eV for phenanthrenequinone (e). |
Calculated excited state transitions of the protonated (O)PAHs using Gaussian16 at the CAM-B3LYP/def2TZVP level of theory.
Appendix C.2 LC-ωHPBE
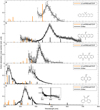 |
Fig. C.2 Action absorption spectra of protonated a) pentacene, b) pentacenequinone, c) pentacenetetrone, d) anthraquinone, and e) phenan-threnequinone. The black lines are smoothing lines to guide the eye. The colored bars indicate calculated excited state transitions (S0 → Sn) computed with the LC-ωHPBE functional combined with the def2TZVP basis set. The height of the bars represent the oscillator strengths. The black vertical bars are the calculated excitation energies redshifted in energy by 1.1 eV for pentacenequinone (b), 0.3 eV for anhtraquinone (d), and 1.5 eV for phenanthrenequinone (e). |
Calculated excited state transitions of the protonated (O)PAHs using Gaussian16 at the LC-ωHPBE/def2TZVP level of theory.
Appendix C.3 ωB97XD functional
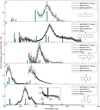 |
Fig. C.3 Action absorption spectra of protonated a) pentacene, b) pentacenequinone, c) pentacenetetrone, d) anthraquinone, and e) phenan-threnequinone. The black lines are smoothing lines to guide the eye. The colored bars indicate calculated excited state transitions (S0 → Sn) computed with the ωB97XD functional combined with three different basis sets. The height of the bars represent the oscillator strengths. The black vertical bars are the calculated excitation energies redshifted in energy by 0.5 eV for pentacenequinone (b), 0.4 eV for pentacenetetrone (c), and 1.6 eV for phenanthrenequinone (e). |
Calculated excited state transitions of the protonated (O)PAHs using Gaussian16 at the ωB97XD/6-311++G(p,d) level of theory.
Calculated excited state transitions of the protonated (O)PAHs using Gaussian16 at the ωB97XD/TZVP level of theory.
Calculated excited state transitions of the protonated (O)PAHs using Gaussian16 at the ωB97XD/def2TZVP level of theory.
Appendix C.4 B3LYP functional
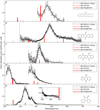 |
Fig. C.4 Action absorption spectra of protonated a) pentacene, b) pentacenequinone, c) pentacenetetrone, d) anthraquinone, and e) phenan-threnequinone. The black lines are smoothing lines to guide the eye. The colored bars indicate calculated excited state transitions (S0 → Sn) computed using the B3LYP functional combined with three different basis sets. The height of the bars represent the oscillator strengths. |
Calculated excited state transitions of the protonated (O)PAHs using Gaussian16 at the B3LYP/6-311++G(d,p) level of theory.
Calculated excited state transitions of the protonated (O)PAHs using Gaussian16 at the B3LYP/TZVP level of theory.
Calculated excited state transitions of the protonated (O)PAHs using Gaussian16 at the B3LYP/def2TZVP level of theory.
Appendix C.5 MN15 functional
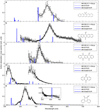 |
Fig. C.5 Action absorption spectra of protonated a) pentacene, b) pentacenequinone, c) pentacenetetrone, d) anthraquinone, and e) phenan-threnequinone. The black lines are smoothing lines to guide the eye. The colored bars indicate calculated excited state transitions (S0 → Sn) computed using the MN15 functional combined with three different basis sets. The height of the bars represent the oscillator strengths. |
Calculated excited state transitions of the protonated (O)PAHs using Gaussian16 at the MN15/6-311G++(p,d) level of theory.
Calculated excited state transitions of the protonated (O)PAHs using Gaussian16 at the MN15/TZVP level of theory.
Calculated excited state transitions of the protonated (O)PAHs using Gaussian16 at the MN15/def2TZVP level of theory.
References
- Allamandola, L. J., Tielens, A. G. G. M., & Barker, J. R. 1985, ApJ, 290, L25 [Google Scholar]
- Andersen, L. H., Bluhme, H., Boyé, S., et al. 2004, Phys. Chem. Chem. Phys., 6, 2617 [NASA ADS] [CrossRef] [Google Scholar]
- Bauschlicher, C. W., Peeters, E., & Allamandola, L. J. 2009, ApJ, 697, 311 [NASA ADS] [CrossRef] [Google Scholar]
- Becke, A. D. 1993, J. Chem. Phys., 98, 5648 [Google Scholar]
- Boissel, P., de Parseval, P., Marty, P., & Lefèvre, G. 1997, J. Chem. Phys., 106, 4973 [NASA ADS] [CrossRef] [Google Scholar]
- Burkhardt, A. M., Lee, K. L. K., Changala, P. B., et al. 2021, ApJ, 913, L18 [Google Scholar]
- Cernicharo, J., Agúndez, M., Cabezas, C., et al. 2021, A & A, 649, L15 [NASA ADS] [CrossRef] [EDP Sciences] [Google Scholar]
- Chai, J.-D., & Head-Gordon, M. 2008, Phys. Chem. Chem. Phys., 10, 6615 [NASA ADS] [CrossRef] [Google Scholar]
- Chakraborty, A., Fulara, J., & Maier, J. P. 2015, J. Chem. Phys., 143, 084312 [NASA ADS] [CrossRef] [Google Scholar]
- Cook, A. M., Ricca, A., Mattioda, A. L., et al. 2015, ApJ, 799, 14 [NASA ADS] [CrossRef] [Google Scholar]
- Dartois, E., & Muñoz-Caro, G. M. 2007, A & A, 476, 1235 [NASA ADS] [CrossRef] [EDP Sciences] [Google Scholar]
- Dartois, E., Marco, O., Muñoz-Caro, G. M., et al. 2004, A & A, 423, 549 [NASA ADS] [CrossRef] [EDP Sciences] [Google Scholar]
- Frisch, M. J., Trucks, G. W., Schlegel, H. B., et al. 2016, Gaussian 16 Revision C.01 (Gaussian Inc. Wallingford CT) [Google Scholar]
- Garkusha, I., Fulara, J., Sarre, P. J., & Maier, J. P. 2011, J. Phys. Chem. A, 115, 10972 [NASA ADS] [CrossRef] [Google Scholar]
- Geballe, T. R. 2016, J. Phys. Conf. Ser., 728, 062005 [NASA ADS] [CrossRef] [Google Scholar]
- Hammonds, M., Pathak, A., & Sarre, P. J. 2009, Phys. Chem. Chem. Phys., 11, 4458 [NASA ADS] [CrossRef] [Google Scholar]
- Hammonds, M., Pathak, A., Candian, A., & Sarre, P. J. 2021, in Spectroscopy of Protonated and Deprotonated PAHs (Paris: EDP Sciences), 373 [Google Scholar]
- Helal, W., Alkhatib, Q., & Gharaibeh, M. 2022, Comput. Theor. Chem., 1207, 113531 [Google Scholar]
- Henderson, T. M., Izmaylov, A. F., Scalmani, G., & Scuseria, G. E. 2009, J. Chem. Phys., 131, 044108 [NASA ADS] [CrossRef] [Google Scholar]
- Hudgins, D. M., Bauschlicher, C. W.Jr., & Allamandola, L. J. 2005, ApJ, 632, 316 [NASA ADS] [CrossRef] [Google Scholar]
- Jaganathan, R., Simonsen, F. D. S., Thrower, J. D., & Hornekœr, L. 2022, A & A, 663, A136 [NASA ADS] [CrossRef] [EDP Sciences] [Google Scholar]
- Joblin, C., Tielens, A. G. G. M., Allamandola, L. J., & Geballe, T. R. 1996, ApJ, 458, 610 [NASA ADS] [CrossRef] [Google Scholar]
- Joblin, C., Wenzel, G., Castillo, S. R., et al. 2020, J. Phys. Conf. Ser., 1412, 062002 [NASA ADS] [CrossRef] [Google Scholar]
- Jones, A. P. 2009, A & A, 500, 277 [NASA ADS] [CrossRef] [EDP Sciences] [Google Scholar]
- Jones, A. P. 2016, R. Soc. Open Sci., 3, 160224 [NASA ADS] [CrossRef] [Google Scholar]
- Jones, A. P., & Ysard, N. 2019, A & A, 627, A38 [NASA ADS] [CrossRef] [EDP Sciences] [Google Scholar]
- Lai, T. S.-Y., Witt, A. N., & Crawford, K. 2017, MNRAS, 469, 4933 [NASA ADS] [CrossRef] [Google Scholar]
- Léger, A., & Puget, J. L. 1984, A & A, 137, L5 [NASA ADS] [Google Scholar]
- Léger, A., Boissel, P., & d’Hendecourt, L. 1988, Phys. Rev. Lett., 60, 921 [Google Scholar]
- Lesniak, L., West, B. J., & Mayer, P. M. 2019, J. Phys. Chem. A, 123, 10694 [NASA ADS] [CrossRef] [Google Scholar]
- Martin, S., Bernard, J., Brédy, R., et al. 2013, Phys. Rev. Lett., 110, 063003 [NASA ADS] [CrossRef] [Google Scholar]
- Materese, C. K., Nuevo, M., & Sandford, S. A. 2015, ApJ, 800, 116 [NASA ADS] [CrossRef] [Google Scholar]
- McGuire, B. A., Loomis, R. A., Burkhardt, A. M., et al. 2021, Science, 371, 1265 [Google Scholar]
- Møller, S. P. 1997, Nucl. Instrum. Methods Phys. Res. Sect. A, 394, 281 [CrossRef] [Google Scholar]
- NIST Mass Spectrometry Data Center, & William E. Wallace 2023, NIST Chemistry WebBook, NIST Standard Reference Database Number 69, eds. P. J. Linstrom, & W. G. Mallard (Gaithersburg MD: National Institute of Standards and Technology), 20899 [Google Scholar]
- Noble, J. A., Dedonder, C., & Jouvet, C. 2015, A & A, 577, A79 [NASA ADS] [CrossRef] [EDP Sciences] [Google Scholar]
- Noble, J. A., Michoulier, E., Aupetit, C., & Mascetti, J. 2020, A & A, 644, A22 [NASA ADS] [CrossRef] [EDP Sciences] [Google Scholar]
- Peach, M. J. G., Benfield, P., Helgaker, T., & Tozer, D. J. 2008, J. Chem. Phys., 128, 044118 [NASA ADS] [CrossRef] [Google Scholar]
- Peeters, E. 2011, Eur. Astron. Soc. Pub. Ser., 46, 13 [NASA ADS] [Google Scholar]
- Peeters, E., Hony, S., Kerckhoven, C. V., et al. 2002, A & A, 390, 1089 [NASA ADS] [CrossRef] [EDP Sciences] [Google Scholar]
- Rasmussen, A. P., Gruber, E., Teiwes, R., Sheves, M., & Andersen, L. H. 2021, Phys. Chem. Chem. Phys., 23, 27227 [NASA ADS] [CrossRef] [Google Scholar]
- Ricca, A., Bauschlicher, C. W., & Allamandola, L. J. 2011, ApJ, 727, 128 [NASA ADS] [CrossRef] [Google Scholar]
- Sadjadi, S., Zhang, Y., & Kwok, S. 2015, ApJ, 807, 95 [NASA ADS] [CrossRef] [Google Scholar]
- Sandford, S. A., Bernstein, M. P., & Materese, C. K. 2013, ApJS, 205, 8 [NASA ADS] [CrossRef] [Google Scholar]
- Sarre, P. J. 2019, MNRAS, 490, L17 [NASA ADS] [CrossRef] [Google Scholar]
- Sephton, M. A. 2013, Geochim. Cosmochim. Acta, 107, 231 [NASA ADS] [CrossRef] [Google Scholar]
- Sita, M. L., Changala, P. B., Xue, C., et al. 2022, ApJ, 938, L12 [NASA ADS] [CrossRef] [Google Scholar]
- Slavicinska, K., Duca, D., Egorov, D., et al. 2022, ACS Earth Space Chem., 6, 1413 [NASA ADS] [CrossRef] [Google Scholar]
- Tielens, A. 2008, Ann. Rev. Astron. Astrophys., 46, 289 [Google Scholar]
- Wagner, D. R., Kim, H., & Saykally, R. J. 2000, ApJ, 545, 854 [CrossRef] [Google Scholar]
- Weigend, F., & Ahlrichs, R. 2005, Phys. Chem. Chem. Phys., 7, 3297 [Google Scholar]
- Wenzel, G., Simon, A., Banhatti, S., et al. 2022, J. Mol. Spectr., 385, 111620 [NASA ADS] [CrossRef] [Google Scholar]
- Witt, A. N., & Lai, T. S.-Y. 2020, Astrophys. Space Sci., 365, 58 [NASA ADS] [CrossRef] [Google Scholar]
- Yanai, T., Tew, D. P., & Handy, N. C. 2004, Chem. Phys. Lett., 393, 51 [NASA ADS] [Google Scholar]
- Yu, H. S., He, X., Li, S. L., & Truhlar, D. G. 2016, Chem. Sci., 7, 5032 [CrossRef] [Google Scholar]
- Zhou, P. 2018, Int. J. Quantum Chem., 118, e25780 [CrossRef] [Google Scholar]
- Zhu, B., Bull, J. N., Ji, M., Zettergren, H., & Stockett, M. H. 2022, J. Chem. Phys., 157, 044303 [NASA ADS] [CrossRef] [Google Scholar]
- Zinck, N., Bodi, A., & Mayer, P. M. 2022, Canadian J. Chem., 100, 729 [Google Scholar]
All Tables
Calculated excited state transitions of the protonated (O)PAHs using Gaussian16 at the CAM-B3LYP/def2TZVP level of theory.
Calculated excited state transitions of the protonated (O)PAHs using Gaussian16 at the LC-ωHPBE/def2TZVP level of theory.
Calculated excited state transitions of the protonated (O)PAHs using Gaussian16 at the ωB97XD/6-311++G(p,d) level of theory.
Calculated excited state transitions of the protonated (O)PAHs using Gaussian16 at the ωB97XD/TZVP level of theory.
Calculated excited state transitions of the protonated (O)PAHs using Gaussian16 at the ωB97XD/def2TZVP level of theory.
Calculated excited state transitions of the protonated (O)PAHs using Gaussian16 at the B3LYP/6-311++G(d,p) level of theory.
Calculated excited state transitions of the protonated (O)PAHs using Gaussian16 at the B3LYP/TZVP level of theory.
Calculated excited state transitions of the protonated (O)PAHs using Gaussian16 at the B3LYP/def2TZVP level of theory.
Calculated excited state transitions of the protonated (O)PAHs using Gaussian16 at the MN15/6-311G++(p,d) level of theory.
Calculated excited state transitions of the protonated (O)PAHs using Gaussian16 at the MN15/TZVP level of theory.
Calculated excited state transitions of the protonated (O)PAHs using Gaussian16 at the MN15/def2TZVP level of theory.
All Figures
|
Fig. 1 Molecular structures of protonated (a) pentacene (279 amu), (b) 6,13-pentacenequinone (309 amu), (c) 5,7,12,14-pentacenetetrone (339 amu), (d) 5,9-anthraquinone (209 amu), and (e) 9,10-phenanthrenequinone (209 amu). |
| In the text | |
|
Fig. 2 Schematic view of the experimental setup, (a) Electrosprayionization source (ESI), (b) The ELISA ion-storage ring. Ions are irradiated in the interaction region and neutral fragments are recorded by the SED and MCP detector. |
| In the text | |
|
Fig. 3 Action absorption spectra of protonated (a) pentacene, (b) pentacenequinone, (c) pentacenetetrone, (d) anthraquinone, and (e) phenanthrenequinone. The errorbars are calculated by propagation of error and are due to counting statistics and laser energy variation. The black lines are smoothing lines to guide the eye. The red bars indicate calculated excited state transitions (S0 → Sn) computed at the CAM-B3LYP/def2TZVP level of theory. The height of the bars corresponds to the oscillator strength. The calculated excitation energies for protonated (b) pentacenequinone and (e) phenanthrenequinone are redshifted to fit the experimental data by 0.5 and 1.5 eV, respectively. |
| In the text | |
|
Fig. 4 Histograms of the neutral fragments counted by the SED as a function of storage time in the ring for protonated (a) pentacene, (b) pentacenequinone, (c) pentacenetetrone, (d) anthraquinone, and (e) phenanthrenequinone. The arrows indicate when the laser was fired. Note the logarithmic y-scale. |
| In the text | |
|
Fig. 5 Mass spectra of positively charged fragments produced by laser irradiation of protonated (a) pentacenequinone at 490 nm and (b) phenanthrenequinone at 420 nm. The vertical lines indicate the parent mass. |
| In the text | |
|
Fig. A.1 Counts as a function of storage time in the ring. Time windows used for data analysis are highlighted in blue. The example is pentacenequinone irradiated by laser pulses in the range 400-500 nm fired after approximately 4 ms of storage time measured on the MCP detector. Note the logarithmic scale. |
| In the text | |
|
Fig. B.1 Fragmentation yield as a function of laser power shows the photon dependences of the signal for protonated a) pentacene, b) pen-tacenequinone, c) pentacenetetrone, d) anthraquinone, and e) phenanthrenequinone. The black dots are recorded with the SED, while the blue dots are recorded by the MCP detector. |
| In the text | |
|
Fig. C.1 Action absorption spectra of protonated a) pentacene, b) pentacenequinone, c) pentacenetetrone, d) anthraquinone, and e) phenanthrenequinone. The black lines are smoothing lines to guide the eye. The colored bars indicate calculated excited state transitions (S0 → Sn) computed with the CAM-B3LYP functional combined with the def2TZVP basis set. The height of the bars represent the oscillator strengths. The black vertical bars are the calculated excitation energies redshifted in energy by 0.5 eV for pentacenequinone (b) and 1.5 eV for phenanthrenequinone (e). |
| In the text | |
|
Fig. C.2 Action absorption spectra of protonated a) pentacene, b) pentacenequinone, c) pentacenetetrone, d) anthraquinone, and e) phenan-threnequinone. The black lines are smoothing lines to guide the eye. The colored bars indicate calculated excited state transitions (S0 → Sn) computed with the LC-ωHPBE functional combined with the def2TZVP basis set. The height of the bars represent the oscillator strengths. The black vertical bars are the calculated excitation energies redshifted in energy by 1.1 eV for pentacenequinone (b), 0.3 eV for anhtraquinone (d), and 1.5 eV for phenanthrenequinone (e). |
| In the text | |
|
Fig. C.3 Action absorption spectra of protonated a) pentacene, b) pentacenequinone, c) pentacenetetrone, d) anthraquinone, and e) phenan-threnequinone. The black lines are smoothing lines to guide the eye. The colored bars indicate calculated excited state transitions (S0 → Sn) computed with the ωB97XD functional combined with three different basis sets. The height of the bars represent the oscillator strengths. The black vertical bars are the calculated excitation energies redshifted in energy by 0.5 eV for pentacenequinone (b), 0.4 eV for pentacenetetrone (c), and 1.6 eV for phenanthrenequinone (e). |
| In the text | |
|
Fig. C.4 Action absorption spectra of protonated a) pentacene, b) pentacenequinone, c) pentacenetetrone, d) anthraquinone, and e) phenan-threnequinone. The black lines are smoothing lines to guide the eye. The colored bars indicate calculated excited state transitions (S0 → Sn) computed using the B3LYP functional combined with three different basis sets. The height of the bars represent the oscillator strengths. |
| In the text | |
|
Fig. C.5 Action absorption spectra of protonated a) pentacene, b) pentacenequinone, c) pentacenetetrone, d) anthraquinone, and e) phenan-threnequinone. The black lines are smoothing lines to guide the eye. The colored bars indicate calculated excited state transitions (S0 → Sn) computed using the MN15 functional combined with three different basis sets. The height of the bars represent the oscillator strengths. |
| In the text | |
Current usage metrics show cumulative count of Article Views (full-text article views including HTML views, PDF and ePub downloads, according to the available data) and Abstracts Views on Vision4Press platform.
Data correspond to usage on the plateform after 2015. The current usage metrics is available 48-96 hours after online publication and is updated daily on week days.
Initial download of the metrics may take a while.