Fig. 3
Download original image
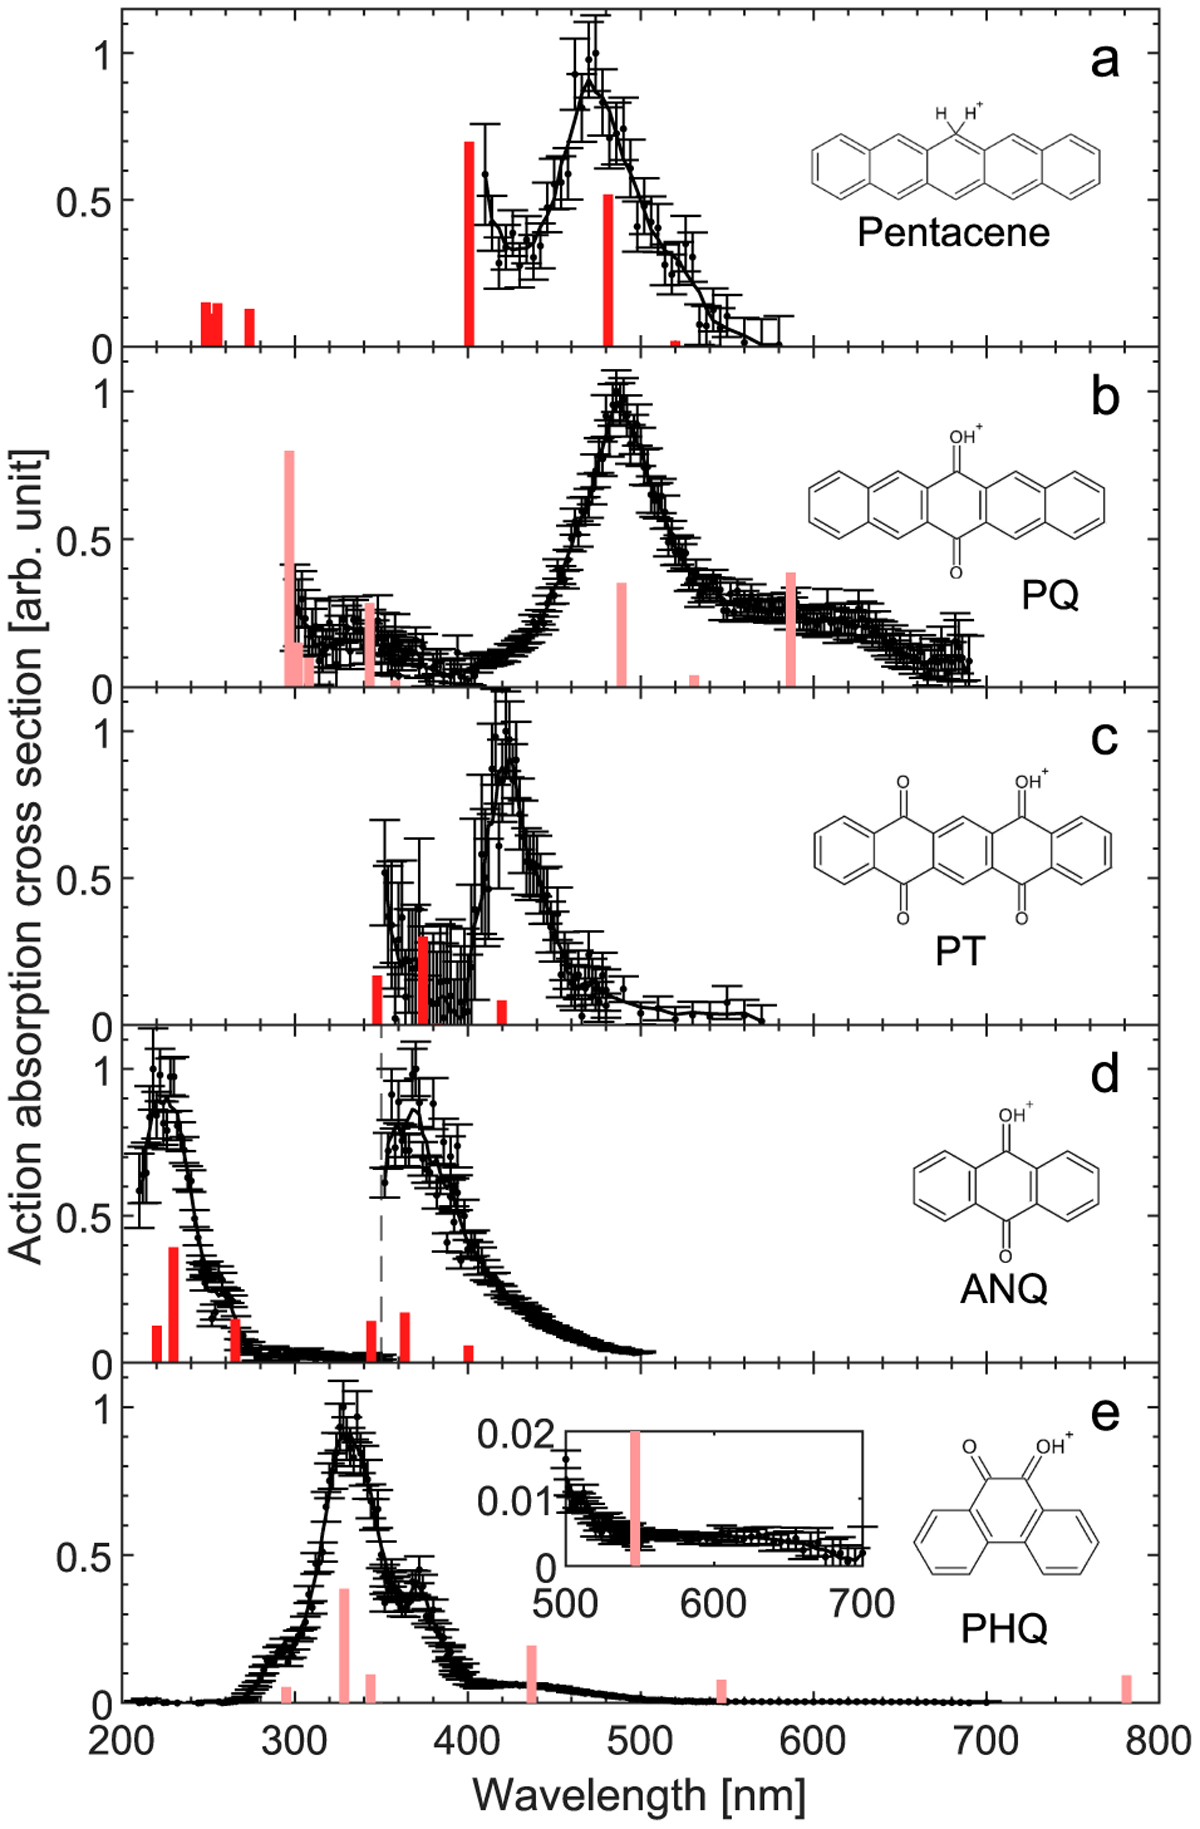
Action absorption spectra of protonated (a) pentacene, (b) pentacenequinone, (c) pentacenetetrone, (d) anthraquinone, and (e) phenanthrenequinone. The errorbars are calculated by propagation of error and are due to counting statistics and laser energy variation. The black lines are smoothing lines to guide the eye. The red bars indicate calculated excited state transitions (S0 → Sn) computed at the CAM-B3LYP/def2TZVP level of theory. The height of the bars corresponds to the oscillator strength. The calculated excitation energies for protonated (b) pentacenequinone and (e) phenanthrenequinone are redshifted to fit the experimental data by 0.5 and 1.5 eV, respectively.
Current usage metrics show cumulative count of Article Views (full-text article views including HTML views, PDF and ePub downloads, according to the available data) and Abstracts Views on Vision4Press platform.
Data correspond to usage on the plateform after 2015. The current usage metrics is available 48-96 hours after online publication and is updated daily on week days.
Initial download of the metrics may take a while.