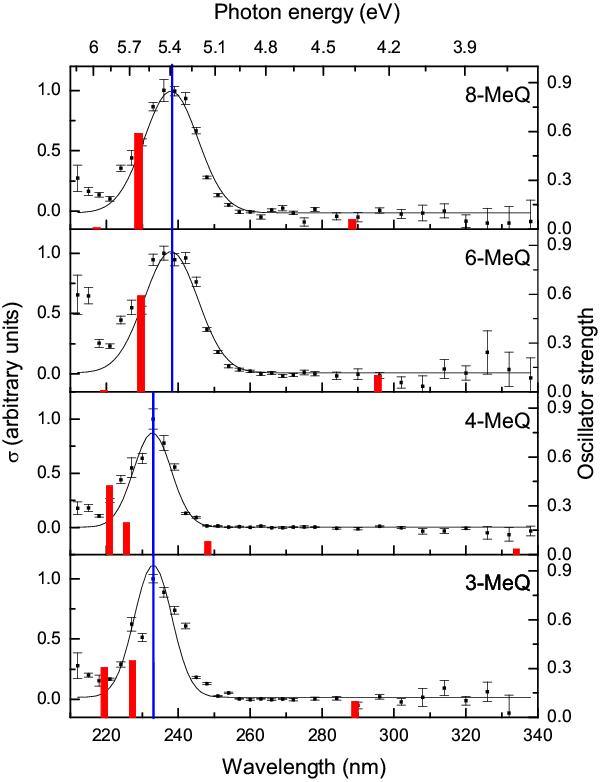
Fig. 4

Measured action spectra of the four methyl-substituted quinolines and the calculated electronic transition and their oscillator strengths. Gaussian profiles with centre at 232 nm (3-MeQ and 4-MeQ) and 238 nm (6-MeQ and 8-MeQ) and widths of 10.5 nm and 15 nm respectively, have been plotted together with the absorption profiles to indicate the spectral differences. It is clearly seen that the absorption profiles depend on the position of the methyl group. The red bars represent calculated oscillator strengths (right vertical axis).
Current usage metrics show cumulative count of Article Views (full-text article views including HTML views, PDF and ePub downloads, according to the available data) and Abstracts Views on Vision4Press platform.
Data correspond to usage on the plateform after 2015. The current usage metrics is available 48-96 hours after online publication and is updated daily on week days.
Initial download of the metrics may take a while.


