Fig. 3
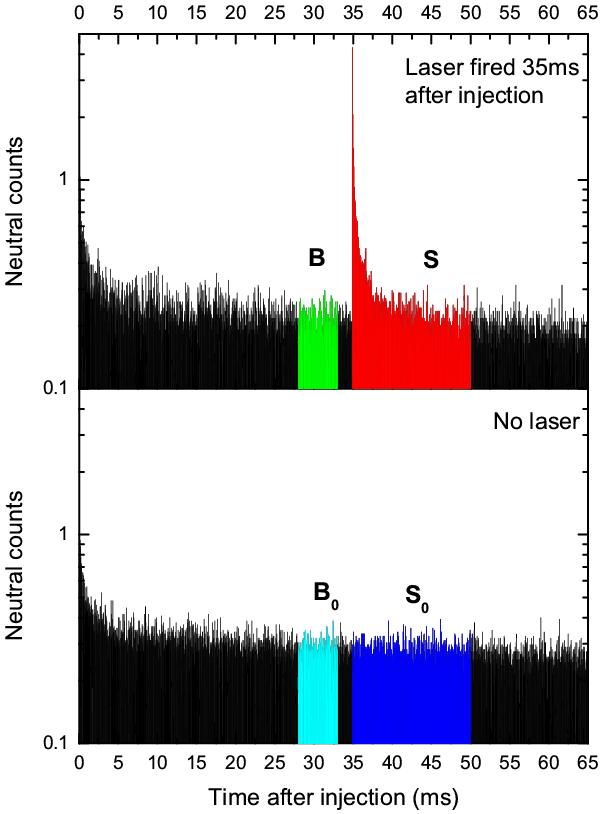
Illustration of the applied technique. The figure shows recordings of neutral fragments produced in the storage ring. The upper and lower panels show a measurement of neutrals produced for 65 ms after injection of ions with and without photo excitation of the ions by a 3 ns duration laser pulse, fired 35 ms after the injection into the ring. The black areas are neutrals produced by collisions of the ions with residual gas in the ring. In the figure, green and cyan respectively indicate background window B and B0, and red and blue signal window S and S0 used in the calculation of the relative action absorption cross section.
Current usage metrics show cumulative count of Article Views (full-text article views including HTML views, PDF and ePub downloads, according to the available data) and Abstracts Views on Vision4Press platform.
Data correspond to usage on the plateform after 2015. The current usage metrics is available 48-96 hours after online publication and is updated daily on week days.
Initial download of the metrics may take a while.