| Issue |
A&A
Volume 532, August 2011
|
|
|---|---|---|
| Article Number | A126 | |
| Number of page(s) | 10 | |
| Section | Stellar structure and evolution | |
| DOI | https://doi.org/10.1051/0004-6361/201116800 | |
| Published online | 04 August 2011 | |
Pulse-amplitude-resolved spectroscopy of bright accreting pulsars: indication of two accretion regimes
1
Institut für Astronomie und Astrophysik, Universität Tübingen (IAAT), Sand 1, 72076 Tübingen, Germany
e-mail: This email address is being protected from spambots. You need JavaScript enabled to view it.
2
Center for Astrophysics and Space Sciences, University of California, San Diego, La Jolla, CA, USA
3
ISDC Data Center for Astrophysics of the University of Geneva chemin d’Écogia, 16 1290 Versoix, Switzerland
Received: 28 February 2011
Accepted: 4 July 2011
Abstract
Context. In addition to coherent pulsation, many accreting neutron stars exhibit flaring activity and strong aperiodic variability on time scales comparable to or shorter than their pulsation period. This behavior shows that the accretion flow in the vicinity of the accretor must be highly non-stationary. Observational study of this phenomenon is often problematic because it requires very high statistics of X-ray data and a specific analysis technique.
Aims. In our research we used high-resolution data taken with RXTE and INTEGRAL on a sample of bright transient and persistent pulsars to perform an in-depth study of their variability on time scales comparable to the pulsation period – ”pulse-to-pulse variability”.
Methods. The high-quality data allowed us to collect individual pulses of different amplitude and explore their X-ray spectrum as a function of pulse amplitude. The described approach allowed us for the first time to study the luminosity dependence of pulsars’ X-ray spectra in observations where the averaged (over many pulse cycles) luminosity of the source remains constant.
Results. In all studied pulsars we reveal significant spectral changes as a function of the pulse height both in the continuum and in the cyclotron absorption features. The sources appear to form two groups that show different dependencies of the spectrum on pulse height. We interpret this division as a manifestation of two distinct accretion regimes that are at work in different pulsars.
Key words: X-rays: binaries / stars: neutron / accretion, accretion disks
© ESO, 2011
1. Introduction
Strong aperiodic variability of the X-ray flux is a well known characteristic of many X-ray binary systems. First discovered in black hole candidates (with Cyg X-1 being the most remarkable case), it was later shown to be a common feature also among accreting neutron stars (see e.g. Belloni & Hasinger 1990, for a review). Although homogeneity and stationarity of the accretion flow is often assumed in calculations dealing with physics inside the X-ray emitting structure on a neutron star (because it greatly simplifies the mathematical treatment of the problem), the observed variability clearly indicates that the accretion flow in the close vicinity of the accretor must be highly non-stationary. On the other hand, the penetration of matter into the magnetosphere of the neutron star around the stopping radius is believed to be governed by various kinds of instabilities that plasma supported by magnetic field is subject to (see e.g. Ghosh & Lamb 1979; Kulkarni & Romanova 2008; Bozzo et al. 2008). The instabilities will naturally lead to fragmentation of a continuous flow into more or less isolated blobs or filaments. More focused theoretical studies of the non-stationary accretion problem have been performed e.g. by Morfill et al. (1984); Demmel et al. (1990), and Orlandini & Boldt (1993), who have explicitly shown that the inhomogeneity of the flow is generally expected in accreting pulsars and that it does not only arise from the original inhomogeneity of the accreted matter (e.g. ”clumps” in the stellar wind or variations of matter supply from the donor star) but can naturally be produced by instabilities close to the magnetospheric boundary of the neutron star.
So far, the aperiodic variability of accreting pulsars has mostly been studied by means of power spectra of their high time-resolution light curves (e.g. Belloni & Hasinger 1990; Pottschmidt et al. 1998; Revnivtsev et al. 2009). In our work, however, we concentrate on the variability of individual X-ray pulses often referred to as pulse-to-pulse variability. This kind of variability seems to be a common phenomenon among accreting pulsars and has been reported by several authors for bright outbursts of some transient or strongly variable sources: Frontera et al. (1985) for A 0535+26, Staubert et al. (1980); Kretschmar et al. (2000) for Vela X-1, Tsygankov et al. (2007) for 4U 0115+63. However, a detailed study of the pulse-to-pulse variability is usually limited by the photon statistics, especially for relatively fast pulsars (with a spin period of a few seconds or less). In the present work, we used the publicly available archival data from high-sensitivity X-ray detectors onboard RXTE and INTEGRAL taken on a set of four bright accreting pulsars – V 0332+53, 4U 0115+63, A 0535+26, and Her X-1.
The four accreting pulsars are well established cyclotron line sources, i.e. their spectra contain cyclotron resonant scattering features (CRSFs). These features appear as absorption lines caused by resonant scattering of photons off the relativistic plasma electrons at Landau levels (see e.g. Trümper et al. 1978; Isenberg et al. 1998; Araya-Góchez & Harding 2000). The CRSFs, if detected, provide a direct way to measure the magnetic field strength at the site of X-ray emission as the energy of the fundamental line and the spacing between the harmonics are proportional to the B-field strength. In some sources the cyclotron line energy was found to change with luminosity. In V 0332+53 and 4U 0115+63 a negative correlation of the line energy with luminosity was observed (Tsygankov et al. 2007, 2010; Mowlavi et al. 2006; Mihara et al. 2004), while for Her X-1 Staubert et al. (2007) reported a positive correlation of the line energy with luminosity.
A description of the observational data is provided in Sect. 2. Using a special analysis technique (described in Sect. 3), we collected individual pulses of different amplitudes and studied the differences in their X-ray spectra. As a result, we reveal significant correlations of different spectral parameters with pulse amplitude (Sect. 4). Based on the sign of the correlations, the explored pulsars can be divided into two groups. We argue that the two groups correspond to two distinct regimes of accretion that are at work in different sources: local sub- and super-Eddington regime (see discussion in Sect. 5). The summary and conclusions are provided in Sect. 6.
2. Observations
For our analysis we used the data taken with the RXTE satellite (Bradt et al. 1993) during the intense outbursts of the transient high-mass X-ray binaries (HMXB) V 0332+53, 4U 0115+63, and A 0535+26 and during a main-on state of the persistent intermediate mass X-ray binary Her X-1 (these states of high X-ray flux occur in the system about every 35 days, most probably reflecting periodic obscuration of the source by a precessing tilted accretion disk, see e.g. Klochkov et al. 2006, and references therein). In the case of A 0535+26 we also used data taken with the INTEGRAL observatory (Winkler et al. 2003) simultaneously with the RXTE observations. The main X-ray instruments onboard the two satellites provide a broad-band coverage of the sources’ X-ray spectra: RXTE/PCA (Jahoda et al. 1996) and INTEGRAL/JEM-X (Lund et al. 2003) are sensitive from a few keV to ~35 keV, while RXTE/HEXTE (Rothschild et al. 1998) and INTEGRAL/IBIS(ISGRI) (Ubertini et al. 2003) – from ~20 keV to a few hundred keV.
Our main criterion for the selection of the observations and instruments was a sufficiently dense timing coverage of the sources during their high flux states, which provides best statistics. Additionally, for RXTE/PCA we searched for the data taken in an appropriate data mode that allows one to achieve simultaneously high time- and energy-resolution in the entire PCA energy range. Specifically, we used the data taken in GoodXenon and certain generic event modes (with sufficient energy- and time-resolution). Where possible, we selected the RXTE observations with both HEXTE clusters switched on to maximize the photon statistics. INTEGRAL data were only used for of A 0535+26, which has a long (~100 s) pulse period. For the other three pulsars with much shorter pulse periods (a few seconds), individual pulsations cannot be distinguished in the INTEGRAL (IBIS/ISGRI) light curves, which prevents pulse-to-pulse study.
Observations used for the pulse-amplitude-resolved analysis.
For each of the three transient sources we used a short continuous set of pointings covering ~1 day or less of the brightest part of an outburst (close to its maximum) so that the average flux level within the observations did not change significantly. The observed flux variability is therefore related to X-ray pulsations and pulse-to-pulse variations. For the persistent pulsar Her X-1 we used the data from the main-on state of the source corresponding to the 35 d cycle No. 323 (according to the numbering convention adopted in Staubert et al. 1983), which is best covered by RXTE observations. We selected the data from the middle part of the main-on where the flux does not change significantly, i.e. where the obscuration by the accretion flow is minimal. The chosen observations of Her X-1 are spread over ~5 d. A summary of the observational data on all sources is provided in Table 1.
3. Analysis technique
The standard data reduction has been performed with the software packages and calibration data provided by the instrument teams. For RXTE we used HEASoft 6.91, for INTEGRAL – OSA 9.02.
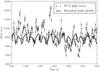 |
Fig. 1 Sample light curve of V 0332+53 during its 2005 giant outburst obtained with RXTE/PCA and summed over all energy channels (2 − 80 keV). The solid curve shows the repeated pulse profile obtained by folding a longer data sample. Dramatic pulse-to-pulse variability is clearly seen. |
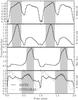 |
Fig. 2 Averaged (over many pulsation cycles) pulse profiles of the pulsars in our sample obtained with RXTE/PCA in 2 − 80 keV range (solid curve) and (in case of A 0535+26) with INTEGRAL/ISGRI in 20 − 100 keV range (dotted curve on the bottom panel). The shaded areas mark the pulse-phase intervals used for our pulse-amplitude-resolved analysis (see text). |
To analyze the pulse-to-pulse variability, for each source we extracted a high-resolution light curve where single pulses are clearly distinguishable. An example of such a light curve obtained with RXTE/PCA in 2 − 80 keV range (this is the entire PCA range, although the effective area of the instrument drops above 30 − 35 keV) on V 0332+53 is shown in Fig. 1 where the strong variability of the profile shape from one pulse to the next is visible. We then selected a pulse-phase interval containing the brightest part of the pulse profile, referred to as pulse. The chosen pulse-phase intervals for each source are shown in Fig. 2 by the shaded areas. For each pulse we calculated its mean count rate (in all PCA channels for the RXTE data and in 20 − 100 keV for the INTEGRAL data), that is the average count rate within the selected pulse-phase interval, which we call the amplitude or height of the pulse. As can be seen in Fig. 1, the amplitude of individual pulses varies over a broad range. This allows one to explore the variation of the X-ray spectrum as a function of pulse amplitude, which is the central point of our research.
The photon statistics does not allow us to extract meaningful spectra of single pulses. Therefore, we grouped together pulses of similar amplitude. For this purpose we explored the distribution of pulse amplitudes for each source and split the entire range of amplitudes into five to six bins, keeping approximately the same statistics within each bin. Then, for each amplitude bin we constructed a list of good time intervals (GTIs) to select the pulses (i.e. the data inside the selected pulse-phase intervals) whose amplitude falls into the bin. Providing the data-processing pipeline with the produced GTIs we extracted the broad-band X-ray spectra for the selected bins, i.e. as a function of pulse height. We note again that the extracted spectra correspond to a fixed pulse-phase interval. This minimizes possible influence of pulse-phase dependence of the spectrum.
To maximize the photon statistics in our spectra, where possible we used PCA data up to 60 keV. Even though the effective area of the instrument at this energy drops dramatically along with an increase of the relative background contribution, the photon statistics is still competitive with that of HEXTE (which suffers from larger dead time). For the spectral analysis of the PCA data we used the updated response v11.7 (2009 May 11) and background estimation files Sky_VLE. According to the instrument team, the new calibration files in combination with the updated HEASoft package (starting from version 6.7) provide significant improvements to spectral analysis and allow one to use PCA data up to ~50 keV with systematic uncertainties of 0.5%3. Our analysis of pulse-averaged spectra between 40 and 60 keV has shown that the PCA spectrum extracted with the new calibration is in complete accord with the HEXTE spectrum for which the background is directly measured during the observations (using the off-set pointings of the collimator). The agreement between the two detectors is also claimed by Rothschild et al. (2011), who also used PCA data up to 60 keV in their analysis of the RXTE observations of Cen A. Following Rothschild et al. (2011), the background model counts histogram was included in the spectral fitting as a correction file to account for small deviations of the background and dead-time models from reality (recorn model in XSPEC 12.6.0). We added systematic uncertainties at the level of 1.0% to our PCA spectra, which are somewhat larger than the recommended 0.5% (see above) but allow us to obtain more conservative estimates of the spectral parameter errors. No systematic errors have been added to HEXTE because it is not recommended by the instrument team (the uncertainties of this instrument are dominated by statistical fluctuations).
For the INTEGRAL instruments we used the standard method of background evaluation from the deconvolution of the detector images provided by the OSA software4. We added systematic uncertainties at the level of 2% to the JEM-X spectra and 1% to the IBIS/ISGRI spectra based on the recommendations of the instrument teams and the Crab observations closest to our observations.
It is known that inaccuracy in the absolute calibration of the X-ray instruments onboard INTEGRAL and RXTE might lead to systematic differences in the observed spectral shape of a source between the two satellites (see e.g. Tsujimoto et al. 2011). In our research, however, we focus on relative variations of the spectral parameters as a function of pulse amplitude rather than their absolute values. Therefore, the cross-calibration accuracy is not critical for our study. We also note that the pulse-averaged cyclotron line energies measured simultaneously with INTEGRAL and RXTE in A 0535+26 (Caballero et al. 2007) and Her X-1 (Klochkov et al. 2008a; Staubert et al. 2007) agree within ~1 keV between the two satellites.
Best-fit spectral parameters of V 0332+53 for different pulse-amplitude bins. The indicated uncertainties are at 1σ (68%) confidence level.
4. Results
For each pulsar in our sample we obtained a series of broad-band (~3−80 keV) X-ray spectra corresponding to different pulse amplitudes. The spectral continua are modeled using the powerlaw-cutoff function. The fluorescent Kα emission at 6.4 keV has been modeled by an additive Gaussian. The absorption cyclotron features are clearly seen in our pulse-amplitude-resolved spectra and are modeled using multiplicative absorption lines with a Gaussian optical depth profile. A more detailed description of the spectral models is provided below, in the subsections devoted to the individual sources. Since the analysis procedures are very similar for all sources in our sample, we provide a full description of our spectral fitting (including a list of spectral parameters, χ2 values etc.) only for the first pulsar, V 0332+53 (Sect. 4.1). For the other the sources we skip the detailed information and concentrate on final results – variations of the spectral parameters with pulse amplitude.
All our spectral fits were checked for possible intrinsic dependencies/degeneracies of different parameter pairs using error contour plots. No significant correlations were found except the one between the photon index and the cutoff energy, which was eliminated by fixing the cutoff energy (see below). The presented results are also found to be stable with respect to the choice of different spectral functions, both for the continuum and the cyclotron absorption lines. We are, therefore, confident that the variability reported below arises from the sources’ behavior and reflects real physics.
4.1. V 0332+53
V 0332+53 belongs to the category of Be/X-ray binaries (BeXRB) – currently the most numerous class of HMXBs. The neutron star in these systems periodically or sporadically accretes mass from the equatorial disk around the Be- or Oe-type optical companion. The episodes of accretion give rise to powerful X-ray outbursts, while in quiescence the X-ray flux often falls below the detection limit of most instruments. The neutron star in V 0332+53 has a spin period of ~4.3 s (Stella et al. 1985). For this source we used the RXTE data close to the maximum of its giant (type II) outburst in 2004 (see e.g. Coe 2000, for the nomenclature of outburst types in BeXRBs), when the bolometric luminosity reached a few times 1038 erg s-1 for a distance of 7 kpc (Tsygankov et al. 2010). Up to three cyclotron features have been detected in the source: the fundamental line at ~26 keV and two harmonics, at ~50 and ~70 keV respectively. As mentioned in the introduction, during the outbursts the fundamental line exhibits a strong negative correlation with the X-ray flux (e.g. Tsygankov et al. 2010; Mowlavi et al. 2006).
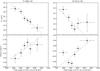 |
Fig. 3 Variation of the fundamental cyclotron line centroid energy Ecyc (top) and the photon index Γ (bottom) with pulse amplitude measured in V 0332+53 (left) and in 4U 0115+63 (right) using the RXTE data. The vertical bars indicate uncertainties at 1σ (68%) confidence level. |
In the short set of RXTE observations that we have analyzed (where the source luminosity did not change significantly, see Sect. 2), the dynamical range of the pulse amplitude variations reached a factor of ~1.5. For this range we defined six amplitude bins and extracted six spectra, one for each bin. The X-ray continuum was modeled using a powerlaw function with an exponential decay toward higher energies – the XSPEC cutoffpl model: I(E) ∝ E − Γexp( − E/Efold), where E is the photon energy, Γ – photon index, and Efold – exponential folding energy. To account for a bump-like feature appearing in the residuals between 10 and 20 keV, we added a broad Gaussian with the centroid energy Ebump ~ 11 keV and a width of σbump ~ 3 keV.
The spectra revealed two absorption features, the fundamental cyclotron line and its first harmonic, which we modeled using Gaussian absorption lines as stated above (the XSPEC gabs multiplicative model: ![Mathematical equation: \hbox{$M(E)\propto \exp{[-\tau_{\rm cyc}/(\sqrt{2\pi}\sigma_{\rm cyc}) \cdot\exp(-0.5(E-E_{\rm cyc})^2/\sigma_{\rm cyc}^2)]}$}](/articles/aa/full_html/2011/08/aa16800-11/aa16800-11-eq67.png) , where Ecyc, σcyc, and τcyc are the centroid energy, width, and optical depth of the line, respectively). To account for uncertainties in the absolute normalization of the flux in different instruments, we introduced in our model a multiplicative factor F which was fixed to 1.0 for PCA and left free for HEXTE. In all pulse-amplitude bins the best-fit value of F for HEXTE was around 0.90(1), indicating a 10% difference in the absolute flux normalization between the two instruments. Similar differences (from 10 to 14%) were found for all other RXTE observations analyzed in this work. The energy range of the spectra was set to 3.5−60 keV for PCA (see Sect. 3 about the usage of PCA at high energies) and to 17–75 keV for HEXTE. The best-fit spectral parameters for each pulse-phase amplitude bin together with the 1σ-uncertainties and the corresponding reduced χ2 values are summarized in Table 2. The parameters of the first cyclotron line harmonic are denoted with “1” in the subscript. Figure 4 shows one of our pulse-amplitude-resolved spectra of V 0332+53 modeled with the described function.
, where Ecyc, σcyc, and τcyc are the centroid energy, width, and optical depth of the line, respectively). To account for uncertainties in the absolute normalization of the flux in different instruments, we introduced in our model a multiplicative factor F which was fixed to 1.0 for PCA and left free for HEXTE. In all pulse-amplitude bins the best-fit value of F for HEXTE was around 0.90(1), indicating a 10% difference in the absolute flux normalization between the two instruments. Similar differences (from 10 to 14%) were found for all other RXTE observations analyzed in this work. The energy range of the spectra was set to 3.5−60 keV for PCA (see Sect. 3 about the usage of PCA at high energies) and to 17–75 keV for HEXTE. The best-fit spectral parameters for each pulse-phase amplitude bin together with the 1σ-uncertainties and the corresponding reduced χ2 values are summarized in Table 2. The parameters of the first cyclotron line harmonic are denoted with “1” in the subscript. Figure 4 shows one of our pulse-amplitude-resolved spectra of V 0332+53 modeled with the described function.
Some spectral parameters that did not show any significant variation with pulse-amplitude were fixed to their averaged (over pulse-amplitude bins) values, as indicated in Table 2. The photon index Γ and the exponential folding energy Efold were found to be strongly coupled (showing intrinsic positive correlation with each other), i.e. the quality of the data did not allow us to determine their variation independently. Efold showed weaker variability with pulse amplitude compared to Γ and was fixed to its average value. Thus, we only explored the variation of Γ as a function of the pulse amplitude.
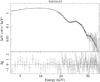 |
Fig. 4 Example of the pulse-amplitude-resolved spectrum of V 0332+53 obtained with PCA and HEXTE (from the pulse-amplitude bin 3650 − 3900 cts/s). The top panel shows the unfolded spectrum modeled with a cutoff-powerlaw function with two absorption lines (see text). The bottom panel shows the corresponding residual plot. |
The data revealed significant changes of the photon index and the energy of the fundamental cyclotron line Ecyc with pulse amplitude as can be seen in Fig. 3 (left column). The horizontal axis of the plots represents the pulse amplitude (determined in the way described in Sect. 3) measured in PCA count rate summed over all energy channels (2 − 80 keV, see above) and normalized to one PCU. The horizontal error-bars indicate the width of the corresponding pulse amplitude bins. An almost linear decrease of Ecyc with pulse height is clearly seen as well as a somewhat less significant softening of the spectrum (reflected by an increase of the photon index Γ). The dotted lines represent linear fits to the data. The measured slope of the Ecyc – pulse-height dependence is (−2.84 ± 0.50) × 10-4 keV/(cts/s). The Pearson linear correlation coefficient is −0.98 with the corresponding two-sided null-hypothesis probability (the probability to find the correlation by chance in a non-correlated data sample) ~4 × 10⁻⁴, indicating a highly significant anti-correlation. The slope of the Γ – pulse-height dependence is (2.21 ± 0.88) × 10-5 (cts/s)-1. The Pearson linear correlation coefficient with the associated two-sided null-hypothesis probability are in this case ~0.77 and ~0.07, respectively. The (positive) correlation in this case is not very significant, but still might indicate a possible physical relation between the parameters.
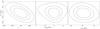 |
Fig. 5 χ2-contour plots for some pairs of spectral parameters of V 0332+53. The χ2-minima are well defined and the parameters show no degeneracy. To generate the plots we used the spectrum from the pulse-amplitude bin 3650 − 3900 cts/s. |
To check the reliability of the shown dependencies, we performed spectral fits with alternative spectral functions for the continuum and cyclotron features: powerlaw × highecut (I(E) ∝ E − Γ below Ecutoff and E − Γexp [ − (E − Ecutoff)/Efold] above Ecutoff) instead of cutoffpl and cyclabs (Lorenzian absorption line) instead of gabs. For all combinations of the continuum and line models the variations of Γ and Ecyc with pulse amplitude emerge with similar significance.
As mentioned above, we checked our fits for any possible statistical (model-dependent) correlations of parameters using χ2-contour plots for different parameter pairs. All free parameters were found to be well decoupled (i.e. showing no or only a weak statistical dependence). In all cases the χ2 minimum and the corresponding confidence range are well defined. Examples of the χ2-contour plots for some parameters are shown in Fig. 5.
The averaged pulse profile of the source shows two almost equally strong peaks (Fig. 2). As described in Sect. 3, we selected for our study a phase interval that includes the first (the highest) peak. However, we repeated our analysis also for the second peak and found very similar dependencies of the spectral parameters on pulse amplitude.
The revealed variation of Ecyc agrees with the negative correlation of the line energy with the averaged (over many pulse cycles) flux level during the rise and decay of the strong outbursts reported for this source (see above). We stress, however, that in our analysis the correlation with pulse height appears in a short (less than one day) set of pointings where the average flux stays roughly constant. The positive correlation of Γ with pulse height, if it is real, is also consistent with the gradual decrease of the averaged photon index observed during the decay of the outburst, which can be derived from Table 2 of Mowlavi et al. (2006).
4.2. 4U 0115+63
Another member of the BeXRB class, 4U 0115+63 has a pulsation period of ~3.6 s (Cominsky et al. 1978). Up to five cyclotron line harmonics have been detected in the X-ray spectrum of the source with the fundamental line at ~11−16 keV having the lowest energy among accreting pulsars (Heindl et al. 1999; Santangelo et al. 1999; Ferrigno et al. 2009, and references therein). Like in V 0332+53, the fundamental line in 4U 0115+63 was found to increase during the decay phase of the giant outbursts (Mihara et al. 2004; Tsygankov et al. 2007). For our analysis we used the RXTE observations of the intense giant outburst of the source in 1999 when the bolometric luminosity exceeded 1038 erg s-1, assuming a distance of 7 kpc (Tsygankov et al. 2007). The data cover roughly 0.5 day of the outburst close to its maximum. In our pulse-amplitude resolved spectra we detected (and modeled using the gabs XSPEC model, see above) the fundamental line and its three harmonics. Following Tsygankov et al. (2007) and Ferrigno et al. (2009), we used the powerlaw × highecut model for the spectral continuum.
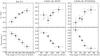 |
Fig. 6 Variation of the fundamental cyclotron line centroid energy Ecyc (top) and the photon index Γ (bottom) with pulse amplitude measured in Her X-1 using the RXTE (left column) and in A 0535+26 using RXTE (middle column), and using INTEGRAL (right column). The vertical bars indicate uncertainties at a 1σ (68%) confidence level. The dotted lines represent linear fits to the data points. |
The amplitude of variations in the pulse height exhibited by 4U 0115+63 in our data sample reached a factor of ~ 2.5. As for V 0332+53, the data quality allowed us to divide the pulse-height distribution into six bins and explore the variations in the centroid energy of the fundamental cyclotron line Ecyc and the photon index Γ with pulse height (Fig. 3, right column). The exponential folding energy Efold was again found to be coupled with Γ. As for V 0332+53, we fixed Efold to its mean (over pulse-height bins) value, 8.2 keV, so that the softening/hardening of the spectral continuum is described by the changes in Γ and the cutoff energy Ecutoff (the latter, however, did not show any significant dependence on pulse amplitude). Parameters of the cyclotron line harmonics showed no significant variation with pulse amplitude.
As can be seen in the top right plot of Fig. 3, the energy of the fundamental cyclotron line decreases with increasing pulse amplitude (probably showing some saturation at highest amplitudes, see below), similarly to V 0332+53. The source also shows softening of the spectrum (increase of the photon index) with increasing pulse height (bottom right plot in Fig. 3), which is also similar to V 0332+53.
As before, the dotted lines represent linear fits to the data points. The measured slopes are ( − 1.32 ± 0.38) × 10-4 keV/(cts/s) for the Ecyc – pulse-height dependence and (4.27 ± 0.68) × 10-5 (cts/s)-1 for the Γ – pulse-height dependence, indicating a significant variation. The Pearson correlation coefficient and the associated two-sided null-hypothesis probability are ~−0.58 and ~0.22 respectively for Ecyc, and ~0.70 and ~0.12 for Γ. As can be seen, the linear correlation inspection indicate only sparse correlations of the parameters. We note, however, that the formal linear correlation analysis does not take into account the uncertainties of the parameters (which are known in our case) and is not very reliable in case of a limited sample (a few points). The formal linear fits taking into account the uncertainties, nevertheless, indicate significant variations (see the slope values above). The two rightmost points in the Ecyc – pulse-height plot (Fig. 3, top right) might indicate some saturation of the downward trend in the cyclotron line energy. However, since the uncertainties associated with the points are larger compared to the other points, the apparent “flattening” might result from poor statistics. The leftmost data point on the Γ – pulse-height plot (Fig. 3, bottom right) significantly deviates from a linear upward trend formed by the other data points. Considering the relatively small uncertainties of the data values, this might indicate a more complicated (than the linear) relation between Γ and the pulse amplitude in this source.
Like in V 0332+53, the decrease of the line energy with the pulse amplitude (which we see on the time scale of single X-ray pulsations) is in line with the negative correlation of Ecyc with the average flux measured on a much longer time scale during the decay of the source’s outbursts.
For 4U 0115+63 we did not find any alternative spectral function that would provide an acceptable fit of the spectral continuum. However, we checked our spectral fits using Lorentzian absorption lines to model CRSFs instead of the Gaussian lines. The reported effects (variations of Ecyc and Γ) appear equally significant in the spectral fits with both types of absorption lines.
4.3. Her X-1
Unlike the V 0332+53 and 4U 0115+63, Her X-1 is a persistent X-ray source. As stated in Sect. 2, the observed regular changes of the source flux are related to the periodic obscuration by matter in the accretion flow, whereas the intrinsic luminosity of the source (estimated to be ~2 × 1037 erg s-1 for a distance of 7 kpc, Reynolds et al. 1997) remains roughly constant (possibly exhibiting, however, long-term changes, see below). The pulsation period of Her X-1 is ~ 1.24 s, which is the shortest period in our sample. Being historically the first source where a cyclotron feature was detected (Trümper et al. 1978), Her X-1 has the most regular and continuous records of the line energy among all accreting neutron stars (e.g. Staubert et al. 2007; Klochkov et al. 2008b). Analyzing the RXTE observations of the source spread over ~10 years, Staubert et al. (2007) found that the cyclotron line centroid energy is positively correlated with the X-ray luminosity, which apparently slowly varies with the amplitude of a factor of two between different main-on states (the authors used the maximum main-on flux as a measure of the source luminosity). This behavior is opposite to that observed in the outbursts of the transient sources V 0332+53 and 4U 0115+63 (see above), making Her X-1 particularly interesting for our pulse-amplitude-resolved study.
We found that the amplitude of the single pulses during the selected observation (covering a large part of a main-on, see Sect. 2) varies by a factor of ~2. For spectral extraction, we selected five pulse-amplitude bins. The spectrum was modeled with the function used by Staubert et al. (2007) (and in most previous spectral studies of Her X-1) – powerlaw × highecut with a Gaussian absorption line to model the CRSF. The exponential cutoff energy Ecutoff was found to be strongly coupled with the photon index Γ and, therefore, was fixed to its average (over all pulse-amplitude bins) value, 21.4 keV. As a result of our analysis, we were able to detect a strong positive correlation between Ecyc and the pulse amplitude during a single main-on state (Fig. 6, top left panel). The slope of the best-fit linear relation (dotted line) is (2.59 ± 0.58) × 10-3 keV/(cts/s). The Pearson linear correlation coefficient is ~0.97, corresponding to the probability to find the correlation by chance (two-sided) of only ~6 × 10⁻³ – highly significant positive correlation. This confirms the dependence found by Staubert et al. (2007) using a completely different approach. Additionally, we detected a negative correlation between the photon index Γ and the pulse amplitude (Fig. 6, bottom left panel), which is contrary to V0332+53 and 4U 0115+63 (see Fig. 6 and the previous subsections). The slopes of the best-fit linear relation (dotted line) between Γ and the pulse height is ( − 7.46 ± 1.56) × 10-5 (cts/s)-1. The Pearson linear correlation coefficient and the corresponding two-sided null-hypothesis probability are ~−0.99 and ~4 × 10⁻⁴ respectively – again, a highly significant (negative) correlation.
As for 4U 0115+63, the powerlaw × highecut function was the only suitable continuum model. Thus, we checked stability of our results only relative to the choice of the cyclotron model: gabs vs. cyclabs. The found correlations are well visible in both models.
4.4. A 0535+26
A 0535+26 is another BeXRB that sporadically shows intense outbursts. It has, however, a much longer pulsation period compared to V 0332+53 and 4U 0115+63 – around 103 s (Finger et al. 1994). Two absorption features, interpreted as cyclotron lines (fundamental and first harmonic), have been observed in the source X-ray spectrum at ~45 keV and ~100 keV (Caballero et al. 2008, and references therein). Contrary to the sources described above, no clear variations of the cyclotron line energy with flux have so far been reported (Caballero et al. 2008).
For A 0535+26 we used the data obtained simultaneously with RXTE and INTEGRAL covering ~1 day around the maximum of the normal outburst in 2005 when the source luminosity reached roughly ~1038 erg s-1 (Caballero et al. 2007). Following Caballero et al. (2007, 2008), we used the XSPEC cutoffpl model (see Sect. 4.1) to describe the spectral continuum and a Gaussian absorption line to model the fundamental CRSF (the first harmonic was not detected in our pulse-amplitude resolved spectra). In case of INTEGRAL we set the energy range to 4 − 30 keV for JEM-X and to 18 − 90 keV for IBIS/ISGRI. As for RXTE, we introduced in our spectral model a multiplicative factor F that was fixed to 1.0 for ISGRI and left free for JEM-X to account for uncertainties in the absolute flux normalization in the two instruments. In all pulse-amplitude bins the best-fit value of F for ISGRI was around 0.96(2), indicating a 4% difference in the absolute flux normalization between the two instruments. Because of the strong intrinsic coupling between the photon index Γ and the exponential folding energy Efold (both in the RXTE and INTEGRAL data), we fixed the latter to its mean value (15.8 keV for RXTE and 16.3 keV for INTEGRAL) and explored only the variation of Γ.
As can be seen in Fig. 6, the data from both satellites independently show a strong indication of a positive correlation between the fundamental cyclotron line energy and the pulse height. The horizontal axis of the plots showing the INTEGRAL data represents the pulse amplitude measured in units of IBIS/ISGRI count rate in the 20 − 100 keV range. The slopes of linear fits to the data (as before, indicated with the dotted lines) are (1.92 ± 0.92) × 10-3 keV/(PCA cts/s) for the RXTE observations (Fig. 6, top middle) and (1.36 ± 0.53) × 10-2 keV/(ISGRI cts/s) for the INTEGRAL observations (Fig. 6, top right). The Pearson correlation coefficients with the associated two-sided null-hypotheses probability values are ~0.70 and ~0.19 respectively for the RXTE data (sparse correlation) and ~0.94 and ~0.02 for the INTEGRAL data. We repeat, however, that the similar relations are found by the two satellites independently, which supports the correlation. Our finding is particularly interesting because no corresponding “long time-scale correlation” of Ecyc with flux has been reported (see above). Our results make A 0535+26 only the second source (after Her X-1) that shows positive correlation of the cyclotron line energy with flux.
Additionally, the data from both satellites show hardening of the spectrum (decrease in Γ) with increasing pulse height, as shown in the bottom panels of the middle and the right column in Fig. 6. The slopes of linear fits to the data (dotted lines) are ( − 1.54 ± 0.19) × 10-4 keV/(PCA cts/s) for the RXTE observations (Fig. 6, bottom middle) and ( − 8.71 ± 0.86) × 10-2 keV/(ISGRI cts/s) for the INTEGRAL observations (Fig. 6, bottom right). The Pearson correlation coefficients with the associated two-sided null-hypotheses probability values are ~−0.98 and ~4 × 10⁻³ respectively for the RXTE data and ~−0.96 and ~0.01 for the INTEGRAL data – a significant correlation in both cases. This (anti-)correlation is contrary to the one observed in V 0332+53 and 4U 0115+63 but similar to the one found in Her X-1, which also shows a positive correlation between Ecyc and pulse amplitude. The negative correlation of Γ with pulse height in A 0535+26 is also in line with Fig. 4 of Caballero et al. (2008) that shows higher values of the photon index at lower luminosities (at the beginning and the end of the outburst).
We note that it is not possible to compare directly the variations of the spectral parameters measured with INTEGRAL and RXTE as a function of pulse amplitude with each other. The high-resolution light curves used for the pulse selection were obtained with INTEGRAL/IBIS/ISGRI and RXTE/PCA in different energy bands (PCA is mostly sensitive below ~35 keV, while IBIS/ISGRI – above 20 keV, see Sect. 2), which leads to systematically different pulse-height distributions. Additionally, as we mentioned in Sect. 3, insufficient intercalibration accuracy of the two observatories might lead to systematic uncertainties in the absolute values of Ecyc and Γ measured with the two instruments. Nevertheless, the relative variations of the spectral parameters with pulse amplitude can still be determined with the two satellites regardless of cross-calibration problems. Thus, the similarity of the parameters behavior found independently with RXTE and INTEGRAL suggests that the obtained effects indicate real physics.
As with other sources, we checked the found correlations using the Lorentzian line profile instead of the Gaussian one and found them to be independent with respect to the choice of the line model.
5. Discussion
The revealed dependencies of the spectral parameters on pulse amplitude in our sample of bright X-ray pulsars are mostly consistent with the long-term spectral changes related to the variability of the averaged luminosity of the sources (e.g. during the outbursts) reported previously, i.e. the correlations between the spectral parameters and flux have the same sign. We note, however, that it is generally impossible to compare our correlations directly with those found on the basis of the long-term flux variations. Our pulse amplitude reflects the flux in a narrow pulse-phase interval, consequently its value and variability range differ substantially from those of the pulse-averaged flux. Therefore, the individual pulse heights cannot easily be converted to the source luminosity as was done for the pulse-averaged flux in the previous works. The spectral parameters in our analysis were also extracted from the narrow pulse-phase interval and are, therefore, different from the pulse-averaged values. The variability of the average (over many pulse cycles) pulse profile along the outbursts in the previously reported “long-term” analyses would additionally complicate the comparison.
It has been argued by several authors that the long-term spectral variability of the cyclotron line energy reflects the changes in the accretion column structure, namely the variable height of the X-ray emitting region above the neutron star surface as a function of the mass accretion rate Ṁ (Mihara et al. 1998; Mowlavi et al. 2006; Staubert et al. 2007). Because the variability revealed in our work apparently takes place on the time scale of single X-ray pulsations, we have to conclude that the characteristic time scale of the changes in the emitting structure (in response to variable Ṁ reflected by the pulse height) are on the order of a few seconds or shorter. Any X-ray spectra accumulated over many subsequent pulsation cycles of a source therefore provide only an average characterization of the accretion structure over a range of its states corresponding to different local accretion rates.
Correlations of spectral parameters with pulse height.
5.1. Two regimes of accretion
Two of the four accreting pulsars studied in this work exhibit a negative correlation of the fundamental cyclotron line energy and a positive correlation of the photon index with pulse amplitude. In the other two sources the correlations are in the opposite direction: a positive correlation of Ecyc and a negative correlation of Γ with pulse height. The correlations quantified by the values of the linear slope and the linear correlation coefficients (see the previous section) are summarized in Table 3. The two groups of pulsars apparently have different physical conditions inside their X-ray emitting structure leading to the different behavior of the spectral parameters.
The “long-term” negative correlation of the cyclotron line energy with the X-ray flux during the rises and decays of the outbursts of V 0332+53 and 4U 0115+63 has been attributed to the variable height of the radiative shock above the accretor surface where a substantial part of the kinetic energy possessed by inflowing matter transforms into radiation (Mihara et al. 1998, 2004; Mowlavi et al. 2006; Tsygankov et al. 2007). The height of the shock in these pulsars is believed to be directly proportional to the local mass accretion rate Ṁ (Basko & Sunyaev 1976). We argue that the negative correlation of Ecyc with pulse amplitude reflects the same physical effect (changing of the shock height with Ṁ) but on much shorter time scales. Indeed, the pulse height most probably reflects the local Ṁ, which is highly variable on short time-scales, leading to the observed pulse-to-pulse variability. On the other hand, the “reaction time” of the emitting structure determined by the characteristic time scales at which the kinetic energy of infalling matter is converted into radiation and the latter diffuses through the column has been shown to be short enough – less than 10-6 − 10-7 s (Orlandini & Boldt 1993; Morfill et al. 1984). The softening of the spectral index with pulse amplitude can also be qualitatively understood in this framework. According to the basic model of the accretion column in Basko & Sunyaev (1976), the plasma temperature in the column monotonically decreases with height (up to the the radiative shock). Thus, at higher Ṁ (i.e. at larger pulse amplitudes) one would expect more soft photons to be produced by the lateral walls of a taller column, which would naturally lead to a softer X-ray spectrum, as is observed.
Generally, the negative Ecyc − Ṁ correlation is only expected if the mass accretion rate is high enough for the radiative shock to form, i.e. if it is above some critical luminosity Lc, roughly corresponding to the local Eddington limit at the polar caps (Basko & Sunyaev 1976; Nelson et al. 1993). If the luminosity is below Lc, a different accretion regime is expected. So far, only one pulsar, Her X-1, has been reported to have a statistically significant positive Ecyc − Ṁ correlation (Staubert et al. 2007). The authors argued that this correlation is indeed expected at the luminosities below Lc, when infalling matter is stopped by the Coulomb drag and collective plasma effects rather than in a radiative shock. Our pulse-amplitude-resolved analysis showed that the positive Ecyc − Ṁ correlation found by Staubert et al. (2007) on the time scale of months to years is also present on the time scale of individual pulses and, consequently, supports the idea that in Her X-1 accretion proceeds in the local sub-Eddington regime (contrary to V 0332+53 and 4U 0115+63).
A positive correlation of Ecyc with pulse height in A 0535+26, which we found here for the first time, apparently reveals the second (after Her X-1) case of a positive Ecyc − Ṁ correlation in an accreting pulsar. A similar to Her X-1 dependence of Γ on pulse amplitude (see Table 3) additionally supports the idea that a different (compared to V 0332+53 and 4U 0115+63) accretion regime is realized in the two sources. We note here that the value of the critical luminosity Lc is expected to vary from one pulsar to another because it generally depends on the B-field strength at the neutron star surface and the area of the polar cap (which might depend on the local magnetic field configuration, i.e. presence of higher multipole components etc.). Thus, it is well possible that the pulsars at a similar luminosity level (as e.g. A 0535+26 and 4U 0115+63) exhibit different accretion regimes.
We note that the small number of sources in our sample does not allow us to extend the obtained results (existence of the two accretion modes described above) to the entire population of accreting pulsars. Further observations of known cyclotron line sources together with discoveries of new X-ray pulsars showing cyclotron line variations would allow one to test our finding on a larger sample of pulsars.
6. Summary and conclusions
We studied the pulse-amplitude-resolved spectral variability in a sample of four bright accreting pulsars using the high-resolution X-ray data taken with RXTE and INTEGRAL. Our analysis revealed for the first time the spectral differences between X-ray pulses of different amplitudes, both in the spectral continuum and in the resonant cyclotron feature.
For the pulsars in which a negative correlation of the cyclotron line energy with flux on longer time scales has been reported previously, we found a similar (negative) correlation on the time scale of singe pulse cycles. In Her X-1 we found a positive correlation of the line energy with pulse height that is consistent with the long-term correlation of the CRSF energy and the maximum main-on flux reported by Staubert et al. (2007). Our analysis revealed a positive correlation of the cyclotron line energy with pulse amplitude in A 0535+26 where no correlation of the CRSF energy with flux has so far been reported.
The pulsars in our sample show two different types of spectral dependencies on pulse amplitude. We argue that the different behaviors reflect two distinct accretion regimes (local sub- and super-Eddington) realized in different pulsars, which was previously proposed to explain the peculiarity of Her X-1 compared to higher-luminosity pulsars.
Acknowledgments
The work was supported by the Carl-Zeiss-Stiftung and by DLR grant BA5027. D.K. thanks Jörn Wilms, Sergey Tsygankov, and Konstantin Postnov for useful discussions. We also thank ISSI (Bern, Switzerland) for its hospitality during the meetings of our collaboration in the frame of the International Teams program.
References
- Araya-Góchez, R. A., & Harding, A. K. 2000, ApJ, 544, 1067 [NASA ADS] [CrossRef] [Google Scholar]
- Basko, M. M., & Sunyaev, R. A. 1976, MNRAS, 175, 395 [NASA ADS] [CrossRef] [Google Scholar]
- Belloni, T., & Hasinger, G. 1990, A&A, 230, 103 [NASA ADS] [Google Scholar]
- Bozzo, E., Falanga, M., & Stella, L. 2008, ApJ, 683, 1031 [NASA ADS] [CrossRef] [Google Scholar]
- Bradt, H. V., Rothschild, R. E., & Swank, J. H. 1993, A&AS, 97, 355 [NASA ADS] [Google Scholar]
- Caballero, I., Kretschmar, P., Santangelo, A., et al. 2007, A&A, 465, L21 [NASA ADS] [CrossRef] [EDP Sciences] [Google Scholar]
- Caballero, I., Santangelo, A., Kretschmar, P., et al. 2008, A&A, 480, L17 [NASA ADS] [CrossRef] [EDP Sciences] [Google Scholar]
- Coe, M. J. 2000, in The Be Phenomenon in Early-Type Stars, ed. M. A. Smith, H. F. Henrichs, & J. Fabregat, IAU Colloq., 175, ASP Conf. Ser., 214, 656 [Google Scholar]
- Cominsky, L., Clark, G. W., Li, F., Mayer, W., & Rappaport, S. 1978, Nature, 273, 367 [NASA ADS] [CrossRef] [Google Scholar]
- Demmel, V., Morfill, G., & Atmanspacher, H. 1990, ApJ, 354, 616 [NASA ADS] [CrossRef] [Google Scholar]
- Ferrigno, C., Becker, P. A., Segreto, A., Mineo, T., & Santangelo, A. 2009, A&A, 498, 825 [NASA ADS] [CrossRef] [EDP Sciences] [Google Scholar]
- Finger, M. H., Wilson, R. B., & Hagedon, K. S. 1994, IAU Circ., 5931, 1 [NASA ADS] [Google Scholar]
- Frontera, F., dal Fiume, D., Morelli, E., & Spada, G. 1985, ApJ, 298, 585 [NASA ADS] [CrossRef] [Google Scholar]
- Ghosh, P., & Lamb, F. K. 1979, ApJ, 232, 259 [NASA ADS] [CrossRef] [Google Scholar]
- Heindl, W. A., Coburn, W., Gruber, D. E., et al. 1999, ApJ, 521, L49 [NASA ADS] [CrossRef] [Google Scholar]
- Isenberg, M., Lamb, D. Q., & Wang, J. C. L. 1998, ApJ, 493, 154 [NASA ADS] [CrossRef] [Google Scholar]
- Jahoda, K., Swank, J. H., Giles, A. B., et al. 1996, in SPIE Conf. Ser. 2808, ed. O. H. Siegmund, & M. A. Gummin, 59 [Google Scholar]
- Klochkov, D. K., Shakura, N. I., Postnov, K. A., et al. 2006, Astron. Lett., 32, 804 [NASA ADS] [CrossRef] [Google Scholar]
- Klochkov, D., Staubert, R., Postnov, K., et al. 2008a, A&A, 482, 907 [NASA ADS] [CrossRef] [EDP Sciences] [Google Scholar]
- Klochkov, D., Staubert, R., Postnov, K., et al. 2008b, in Proceedings of the 7th INTEGRAL Workshop [Google Scholar]
- Kretschmar, P., Kreykenbohm, I., Wilms, J., et al. 2000, in AIP Conf. Ser. 510, ed. M. L. McConnell, & J. M. Ryan, 163 [Google Scholar]
- Kulkarni, A. K., & Romanova, M. M. 2008, MNRAS, 386, 673 [NASA ADS] [CrossRef] [Google Scholar]
- Lund, N., Budtz-Jørgensen, C., Westergaard, N. J., et al. 2003, A&A, 411, L231 [NASA ADS] [CrossRef] [EDP Sciences] [Google Scholar]
- Mihara, T., Makishima, K., & Nagase, F. 1998, Adv. Space Res., 22, 987 [NASA ADS] [CrossRef] [Google Scholar]
- Mihara, T., Makishima, K., & Nagase, F. 2004, ApJ, 610, 390 [NASA ADS] [CrossRef] [Google Scholar]
- Morfill, G. E., Truemper, J., Tenorio-Tagle, G., & Bodenheimer, P. 1984, A&A, 139, 7 [NASA ADS] [Google Scholar]
- Mowlavi, N., Kreykenbohm, I., Shaw, S. E., et al. 2006, A&A, 451, 187 [Google Scholar]
- Nelson, R. W., Salpeter, E. E., & Wasserman, I. 1993, ApJ, 418, 874 [NASA ADS] [CrossRef] [Google Scholar]
- Orlandini, M., & Boldt, E. 1993, ApJ, 419, 776 [NASA ADS] [CrossRef] [Google Scholar]
- Pottschmidt, K., Koenig, M., Wilms, J., & Staubert, R. 1998, A&A, 334, 201 [NASA ADS] [Google Scholar]
- Revnivtsev, M., Churazov, E., Postnov, K., & Tsygankov, S. 2009, A&A, 507, 1211 [NASA ADS] [CrossRef] [EDP Sciences] [Google Scholar]
- Reynolds, A. P., Quaintrell, H., Still, M. D., et al. 1997, MNRAS, 288, 43 [NASA ADS] [CrossRef] [Google Scholar]
- Rothschild, R. E., Blanco, P. R., Gruber, D. E., et al. 1998, ApJ, 496, 538 [NASA ADS] [CrossRef] [Google Scholar]
- Rothschild, R. E., Markowitz, A., Rivers, E., et al. 2011, ApJ, 733, 23 [NASA ADS] [CrossRef] [Google Scholar]
- Santangelo, A., Segreto, A., Giarrusso, S., et al. 1999, ApJ, 523, L85 [NASA ADS] [CrossRef] [Google Scholar]
- Staubert, R., Kendziorra, E., Pietsch, W., et al. 1980, ApJ, 239, 1010 [NASA ADS] [CrossRef] [Google Scholar]
- Staubert, R., Bezler, M., & Kendziorra, E. 1983, A&A, 117, 215 [NASA ADS] [Google Scholar]
- Staubert, R., Shakura, N. I., Postnov, K., et al. 2007, A&A, 465, L25 [NASA ADS] [CrossRef] [EDP Sciences] [Google Scholar]
- Stella, L., White, N. E., Davelaar, J., et al. 1985, ApJ, 288, L45 [NASA ADS] [CrossRef] [Google Scholar]
- Trümper, J., Pietsch, W., Reppin, C., et al. 1978, ApJ, 219, L105 [NASA ADS] [CrossRef] [Google Scholar]
- Tsujimoto, M., Guainazzi, M., Plucinsky, P. P., et al. 2011, A&A, 525, A25 [NASA ADS] [CrossRef] [EDP Sciences] [Google Scholar]
- Tsygankov, S. S., Lutovinov, A. A., Churazov, E. M., & Sunyaev, R. A. 2007, Astron. Lett., 33, 368 [NASA ADS] [CrossRef] [Google Scholar]
- Tsygankov, S. S., Lutovinov, A. A., & Serber, A. V. 2010, MNRAS, 401, 1628 [NASA ADS] [CrossRef] [Google Scholar]
- Ubertini, P., Lebrun, F., Di Cocco, G., et al. 2003, A&A, 411, L131 [NASA ADS] [CrossRef] [EDP Sciences] [Google Scholar]
- Winkler, C., Gehrels, N., Schönfelder, V., et al. 2003, A&A, 411, L349 [NASA ADS] [CrossRef] [EDP Sciences] [Google Scholar]
All Tables
Best-fit spectral parameters of V 0332+53 for different pulse-amplitude bins. The indicated uncertainties are at 1σ (68%) confidence level.
All Figures
|
Fig. 1 Sample light curve of V 0332+53 during its 2005 giant outburst obtained with RXTE/PCA and summed over all energy channels (2 − 80 keV). The solid curve shows the repeated pulse profile obtained by folding a longer data sample. Dramatic pulse-to-pulse variability is clearly seen. |
| In the text | |
|
Fig. 2 Averaged (over many pulsation cycles) pulse profiles of the pulsars in our sample obtained with RXTE/PCA in 2 − 80 keV range (solid curve) and (in case of A 0535+26) with INTEGRAL/ISGRI in 20 − 100 keV range (dotted curve on the bottom panel). The shaded areas mark the pulse-phase intervals used for our pulse-amplitude-resolved analysis (see text). |
| In the text | |
|
Fig. 3 Variation of the fundamental cyclotron line centroid energy Ecyc (top) and the photon index Γ (bottom) with pulse amplitude measured in V 0332+53 (left) and in 4U 0115+63 (right) using the RXTE data. The vertical bars indicate uncertainties at 1σ (68%) confidence level. |
| In the text | |
|
Fig. 4 Example of the pulse-amplitude-resolved spectrum of V 0332+53 obtained with PCA and HEXTE (from the pulse-amplitude bin 3650 − 3900 cts/s). The top panel shows the unfolded spectrum modeled with a cutoff-powerlaw function with two absorption lines (see text). The bottom panel shows the corresponding residual plot. |
| In the text | |
|
Fig. 5 χ2-contour plots for some pairs of spectral parameters of V 0332+53. The χ2-minima are well defined and the parameters show no degeneracy. To generate the plots we used the spectrum from the pulse-amplitude bin 3650 − 3900 cts/s. |
| In the text | |
|
Fig. 6 Variation of the fundamental cyclotron line centroid energy Ecyc (top) and the photon index Γ (bottom) with pulse amplitude measured in Her X-1 using the RXTE (left column) and in A 0535+26 using RXTE (middle column), and using INTEGRAL (right column). The vertical bars indicate uncertainties at a 1σ (68%) confidence level. The dotted lines represent linear fits to the data points. |
| In the text | |
Current usage metrics show cumulative count of Article Views (full-text article views including HTML views, PDF and ePub downloads, according to the available data) and Abstracts Views on Vision4Press platform.
Data correspond to usage on the plateform after 2015. The current usage metrics is available 48-96 hours after online publication and is updated daily on week days.
Initial download of the metrics may take a while.