Fig. 2
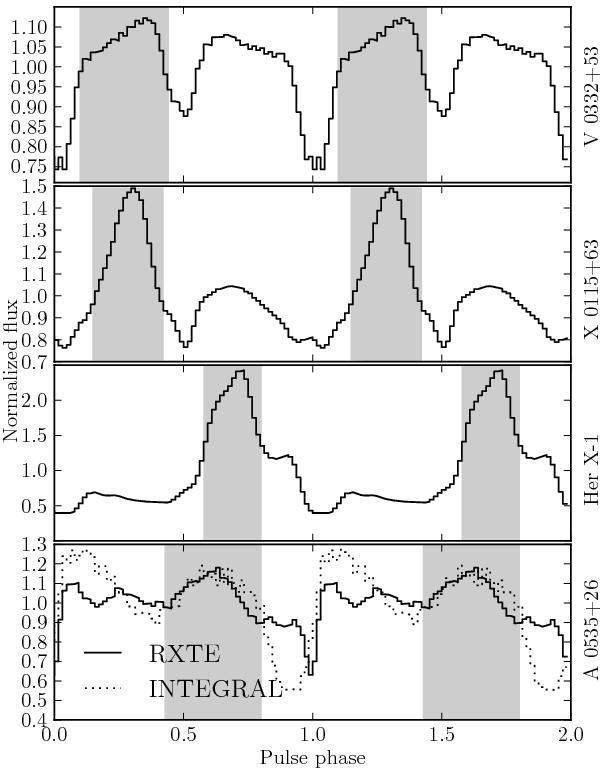
Averaged (over many pulsation cycles) pulse profiles of the pulsars in our sample obtained with RXTE/PCA in 2 − 80 keV range (solid curve) and (in case of A 0535+26) with INTEGRAL/ISGRI in 20 − 100 keV range (dotted curve on the bottom panel). The shaded areas mark the pulse-phase intervals used for our pulse-amplitude-resolved analysis (see text).
Current usage metrics show cumulative count of Article Views (full-text article views including HTML views, PDF and ePub downloads, according to the available data) and Abstracts Views on Vision4Press platform.
Data correspond to usage on the plateform after 2015. The current usage metrics is available 48-96 hours after online publication and is updated daily on week days.
Initial download of the metrics may take a while.