Free Access
Fig. 1
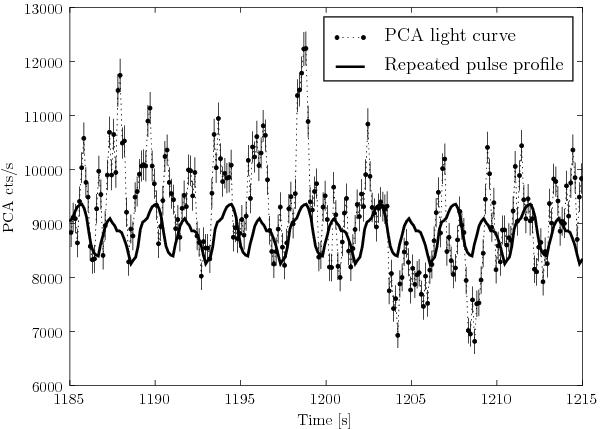
Sample light curve of V 0332+53 during its 2005 giant outburst obtained with RXTE/PCA and summed over all energy channels (2 − 80 keV). The solid curve shows the repeated pulse profile obtained by folding a longer data sample. Dramatic pulse-to-pulse variability is clearly seen.
Current usage metrics show cumulative count of Article Views (full-text article views including HTML views, PDF and ePub downloads, according to the available data) and Abstracts Views on Vision4Press platform.
Data correspond to usage on the plateform after 2015. The current usage metrics is available 48-96 hours after online publication and is updated daily on week days.
Initial download of the metrics may take a while.