| Issue |
A&A
Volume 532, August 2011
|
|
|---|---|---|
| Article Number | A48 | |
| Number of page(s) | 8 | |
| Section | Astrophysical processes | |
| DOI | https://doi.org/10.1051/0004-6361/201116505 | |
| Published online | 21 July 2011 | |
GRB 100614A and GRB 100615A: two extremely dark gamma-ray bursts
1
INAF – Osservatorio Astronomico di Roma, via Frascati 33, 00040 Monteporzio Catone, Italy
e-mail: This email address is being protected from spambots. You need JavaScript enabled to view it.
2
ASI-Science Data Center, via Galileo Galilei, 00044 Frascati, Italy
Received: 12 January 2011
Accepted: 3 June 2011
Abstract
Context. Dark gamma-ray bursts (GRBs) are sources with no or faint optical/near infrared (NIR) afterglow with respect to the X-ray one. Three possible explanations of this optical darkness have been proposed, namely: i) the GRB might be at high redshift, such that the Lyman α absorption prevents optical identifications; ii) dust in the GRB host galaxy may absorb the optical/NIR wavelengths; and iii) the optical faintness might have an intrinsic origin.
Aims. We study two dark GRBs discovered by Swift, namely, GRB 100614A and GRB 100615A. These sources are bright in the X-rays, but no optical/NIR afterglow has been detected for either source, despite the efforts of several follow-up campaigns that have been performed since soon after the GRB explosion.
Methods. We analyze the X-ray data and collect all the optical/NIR upper limits in literature for these bursts. We then build optical-to-X-ray spectral energy distributions (SEDs) at the times at which the reddest upper limits are available, and we model our SEDs with the attenuation curves of the Milky Way (MW), Small Magellanic Cloud (SMC), and one obtained for a sample of starburst galaxies.
Results. We find that to explain the deepest NIR upper limits assuming either a MW or SMC extinction law, the visual extinction towards GRB 100614A is AV > 47 mag, while for GRB 100615A we obtain AV > 58 mag using data taken within one day after the burst and AV > 22 mag even 9.2 days after the trigger.
Conclusions. If these bursts were strongly extincted by dust, these results imply that a MW or SMC-like dust obscuration is unlikely to be able to explain their optical darkness. Since both GRBs are bright in X-rays, explanation iii) also cannot explain their dark classification, unless optical radiation and X-rays are not part of the same synchrotron spectrum. In particular, the X-ray emission during the first 100 − 10 000 s after the burst, shows in ~70% of the cases a “shallow phase” unexpected by the fireball model, typically not tracked at optical wavelengths, that could mimic a stronger optical dust extinction than the real one. An alternative, or complementary explanation of the previous possibility, involves greyer extinction laws. A starburst attenuation curve gives AV > 11 (AV > 15) for GRB 100614A (GRB 100615A) before 1 day after the burst, which is less extreme, despite still very high. Assuming high redshift in addition to extinction, implies that AV > 10 at z = 2 and AV > 4−5 at z = 5, regardless of the adopted extinction recipe. These lower limits are well above the AV computed for previous GRBs at known redshift, but not unlikely. A different, exotic possibility would be an extremely high redshift origin (z > 17 given the missing K detections). Population III stars are expected to emerge at z ~ 20 and can produce GRBs with energies well above those inferred for our GRBs at these redshifts. However, high NH values (above the Galactic ones) toward our GRBs challenge this scenario. Mid- and far-IR late afterglow (>105 s after trigger) observations of these extreme class of GRBs can help us to differentiate between the proposed scenarios.
Key words: gamma-ray burst: general / dust, extinction / stars: Population III / gamma-ray burst: individual: GRB 100614A / gamma-ray burst: individual: GRB 100615A
© ESO, 2011
1. Introduction
Long-duration gamma-ray bursts (GRBs) are high energy phenomena linked to the death of massive stars, emitting most of their radiation in the hundreds of keV range. The gamma-ray (or prompt) event is followed by an afterglow at longer wavelengths, which is crucial to understand the physics of these sources and investigate the nature of their surrounding medium.
While the X-ray (0.1–10 keV) afterglow is virtually detected for all GRBs, the optical/near infrared (NIR) one is more elusive. The first optical afterglow detection (van Paradijs et al. 1997) suggested the idea that every GRB had an optical counterpart. However, just a few months later, the search for the optical afterglow associated with GRB 970828 was unsuccessful (Groot et al. 1998), leading to the definition of “dark burst” to underline a GRB with an X-ray counterpart, but not an optical one. GRB 970828 was not an isolated event, and the low success rate in the optical/NIR detection of afterglows became a hot GRB topic (see e.g., Fynbo et al. 2001; Lazzati et al. 2002). Initially, this lack of detection was widely associated with the delay time between the GRB and the optical observations, since ground-based facilities could be on target only several hours after the trigger, when the afterglow faded below their sensitivity threshold.
The main scientific driver of the Swift satellite (Gehrels et al. 2004) was to facilitate the GRB afterglow detection through a quick repointing with its narrow field instruments (XRT in the 0.3–10 keV band, Burrows et al. 2005, and UVOT at UV/optical wavelengths; Roming et al. 2005) and a fast dissemination of the GRB coordinates worldwide. Despite these instruments repoint the target fewer than two minutes after the prompt event, the UVOT detection rate is just ~40% (Roming & Mason 2006). However, the quick detection with XRT and the increasing number of ground-based automated facilities dramatically improved the optical follow-up success, reducing the fraction of dark GRBs.
The optical darkness can be ascribed to different factors (see e.g., Fynbo et al. 2001; Perley et al. 2009). First, the GRB can be at high redshift, so that the Lyman α absorption prevents optical identifications. Second, dust in the GRB host galaxy or along the line of sight can absorb the optical afterglow counterpart. Finally, the optical faintness can have an intrinsic origin.
The definition of dark GRB evolved as more data became available. Originally, a dark GRB was an event with an X-ray afterglow but no optical detection (Fynbo et al. 2001). Then, brightness and time limits were added to make this definition more specific, e.g., R > 23 within 12 h after the prompt event. Finally, the physics of the GRB was involved in the dark/bright dichotomy. The basic prediction of the fireball model (Mészáros & Rees 1997), which is commonly invoked to explain the afterglow, is that synchrotron radiation is responsible for the optical-to-X-ray emission. According to this model, the spectral index in the optical and X-rays is a function of the power-law index p of the electron energy distribution, and is (p − 1) / 2 or p / 2 depending where the synchrotron cooling (injection) frequency in the slow (fast) cooling regime is located with respect to the observed band (Sari et al. 1998). The simplest blast wave models (Wijers et al. 1997; Sari et al. 1998) predict p ≥ 2, which translates to a spectral index ≥ 0.5. In this framework, Jakobsson et al. (2004) proposed a classification in which dark GRBs had an optical-to-X-ray spectral index βOX < 0.5. Despite many GRBs behaving this way, it has been shown that p < 2 is achievable both observationally and theoretically, by introducing a high-energy cut-off in the electron distribution (see e.g., Dai & Cheng 2001; Starling et al. 2008, and references therein). Thus, βOX can in principle be lower than 0.5 in the synchrotron model. Rol et al. (2005) proposed a classification criterion based on the faintest allowed extrapolation of the X-ray flux to the optical regime, inferring the p value from both the X-ray spectral and temporal indices according to the fireball closure relationships (see e.g. Sari et al. 1998).
Another approach was proposed by van der Horst et al. (2009). They noted that, regardless of many assumptions about the specific electron energy distribution, if both the optical and X-ray radiation are produced by synchrotron emission from the same source, the spectral indices in the optical (βO) and X-ray (βX) bands are linked. In particular, βO = βX − 0.5 if the cooling frequency lies between the optical and the X-rays, and βO = βX otherwise. Thus, the optical-to-X-ray spectral index allowed range is βX − 0.5 ≤ βOX ≤ βX, with βOX = βX − 0.5 if a spectral break is present just below the lowest X-ray energy detected. GRB afterglows with βOX < βX − 0.5 are classified as dark in this picture.
The complex nature of the X-ray lightcurve revealed by Swift between a few tens of seconds and several hours after the trigger, places some constraints on the dark GRB identification methods mentioned above based on the assumption that both the optical and X-ray emission have the same origin, that is, lie on the same energy spectrum. The steep initial decay observed in most X-ray afterglow light curves and not at optical wavelengths, is indeed thought to be produced by the prompt emission, thus by a mechanism different from the one responsible for the afterglow. The optical and X-ray spectral energy distributions (SEDs) should then be compared after the initial steep decay in order to be sure that the prompt emission is not dominating the X-ray afterglow emission and that early optical flashes from reverse shocks are not present (see, e.g., van der Horst et al. 2009). In addition, in about 70% of Swift/XRT detected afterglows, the X-ray light curve between a few hundreds of seconds (thus at the end of the steep decay) up to several minutes/hours shows a plateau phase that is on average not present in the optical counterpart (e.g. Nousek et al. 2006; Liang et al. 2009). This behavior is not predicted by the standard fireball model. After the plateau phase, alternatively called the “shallow phase”, the X-ray light curve decays following the afterglow behavior expected from the fireball model. Interestingly, the transition from the “shallow phase” to the “normal phase” is not accompanied by any spectral variation (see e.g. Liang et al. 2009). The interpretation of the so-called “shallow phase” observed in the Swift GRB X-ray afterglow remains unclear. Therefore, the spectral extrapolation to the optical observation times should be interpreted with caution.
Here we study the “darkness” properties of two GRBs (namely, GRB 100614A and GRB 100615A), which are very bright in X-rays, but are not detected in the optical/near-IR band and have no reported host galaxy candidate. The paper is organized as follows. Section 2 summarizes the discovery and observations of these two sources, Sect. 3 presents instead our analysis method, Sect. 4 illustrates our results, and in Sect. 5 we discuss our findings and draw our conclusions. In the following, we assume a concordance cosmology with H0 = 70 km s-1 Mpc-1, Ωm = 0.3, ΩΛ = 0.7. Decay, photon, and spectral indices are indicated with α, Γ, and β, following the standard convention t − α,  , and ν − β, respectively.
GRB 100614A and GRB 100615A ground-based observation summary.
2. The dataset
2.1. GRB 100614A
GRB 100614A was discovered by Swift on June 14, 2010, at 21:38:26 UT (Stratta et al. 2010). The Swift/BAT (15–350 keV) coded mask-weighted light curve shows a relatively smooth peak starting at ~T − 10 s, peaking around T + 50 s, and ending at ~T + 275 s, where T is the trigger time. The burst duration has been estimated as T90 = 225 ± 55 s, thus classifying this burst among the long GRBs. The time-averaged spectrum is best fit by a simple power-law model with photon index 1.88 ± 0.15. The 15–150 keV fluence is (2.7 ± 0.2) × 10-6 erg cm-2 (Sakamoto et al. 2010).
XRT and UVOT observations were initiated 133 s and 873 s after the BAT trigger, respectively. XRT immediately found a bright afterglow. The astrometrically corrected X-ray afterglow position (using the XRT-UVOT alignment and matching UVOT field sources to the USNO-B1 catalogue) with 3.4 ks of exposure, is RA(J2000) = 17h33m59.82s and Dec(J2000) = +49d14′03.6″ (1.7″ radius, 90% confidence, Osborne et al. 2010), while UVOT did not detect the optical counterpart despite the low Galactic reddening in the direction of this burst (E(B − V) of 0.03 mag, Schlegel et al. 1998). The XRT follow-up (Margutti et al. 2010) continued up to about eight days after the trigger and the overall light curve shows the canonical “steep-flat-normal” decay (e.g. Nousek et al. 2006).
XMM-Newton also observed GRB 100614A, starting at 04:12 UT, on June 15, 2010, for an exposure of 42 ks (Schartel 2010), but no results from data analysis have yet been published. Several optical follow-up observations have been performed with no optical/NIR counterpart detection. Table 1 summarizes the optical/NIR upper limits to the GRB 100614A afterglow, together with its X-ray flux at 1.7 keV at the corresponding acquisition times. Magnitudes are in the Vega system (unless otherwise stated, see footnotes), but not corrected for Galactic extinction. The mean observational epochs from trigger are quoted in the second column. Bold face characters indicate the epochs with the reddest and deepest upper limits. Figure 1 (top panel) shows the X-ray light curve and all the optical/NIR upper limits reported in Table 1.
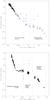 |
Fig. 1 GRB 100614A (upper panel) and GRB 100615A (bottom panel) X-ray lightcurves, together with all the optical/NIR upper limits estimated using several ground-based facilities (see Table 1 for details). Cyan, blue, magenta, green, yellow, black and red upper limits represents the g′ (and all those bands bluer than g′), R, I, z, J, H, K bands, respectively. Vertical dashed lines emphasize the reddest observations and the time at which they have been obtained. Such observations are used in our analysis. The faintest X-ray data in the bottom panel draws the GRB 100615A Chandra observation (Butler et al. 2010). |
2.2. GRB 100615A
GRB 100615A was discovered by Swift on June 15, 2010, at 01:59:03 UT (D’Elia et al. 2010). The Swift/BAT (15–350 keV) coded mask-weighted light curve shows three slightly overlapping FRED (fast rise exponential decay) peaks. The burst duration has been estimated as T90 = 39 ± 2 s. The time-averaged spectrum is best fit by a simple power-law model with photon index of 1.87 ± 0.04. The fluence in the 15–150 keV band is (5.0 ± 0.1) × 10-6 erg cm-2.
XRT and UVOT observations were initiated about a minute after the BAT trigger. XRT immediately found a bright afterglow. The astrometrically corrected X-ray afterglow position (using the XRT-UVOT alignment and matching UVOT field sources to the USNO-B1 catalogue) with 5.2 ks of exposure is RA(J2000) = 11h48m49.26s and Dec(J2000) = –19d28′52.4″ (1.4″ error radius at the 90% confidence, Osborne et al. 2010), while UVOT did not detect the optical counterpart despite the low Galactic reddening in the direction of this burst (E(B − V) of 0.05 mag, Schlegel et al. 1998). XRT follow-up continued up to about two days after the trigger. As for GRB 100614A, the overall light curve shows the canonical “steep-flat-normal” decay.
A DDT was issued and approved to observe the X-ray afterglow with Chandra (Butler et al. 2010). The source was still visible six days after the burst, and the position was refined to RA, Dec (J2000) = 11h48m49 34, –19d28′52.0″ with uncertainty of 0.6″, and the spectral parameters were found to be in agreement with those obtained analyzing the XRT data (see next section). The optical/NIR afterglow was searched starting from a few minutes from the BAT trigger, using four ground-based facilities, but only upper limits to its emission could be set. Table 1 summarizes the optical/NIR upper limits for the GRB 100615A afterglow, together with its X-ray flux at 1.7 keV at the corresponding acquisition times. Magnitudes are in Vega system (unless otherwise stated, see footnotes), but not corrected for Galactic extinction. The mean observational epochs from trigger are quoted in the second column. Bold face characters indicate the epochs with the reddest and deepest upper limits. Figure 1 (bottom panel) shows the X-ray light curve and all the optical/NIR upper limits for GRB 100615A.
3. Data analysis
We extract the optical to X-ray SED for both GRBs by selecting those epochs at which we have the deepest and reddest observations (i.e. less affected by any dust extinction), to constrain at best the intrinsic optical afterglow flux upper limit. In addition, we attempt to select an epoch not too close to the initial X-ray steep decay, which is thought to be produced by a different component than the one responsible for the afterglow emission. Magnitudes were corrected for Galactic absorption.
Swift/XRT data were calibrated, filtered and screened using the XRTDAS package included in the HEAsoft distribution (v6.10) as described in the XRT Software User’s Guide1. Unabsorbed X-ray fluxes were estimated at the selected epochs (see below).
A broken power-law model was fitted to the data following the van der Horst et al. (2009) method, therefore fixing the SED normalization and the high-energy spectral index to the value obtained from our X-ray data analysis (within its 90% confidence range), the spectral break at the X-ray energies and the optical to X-ray spectral index as βOX = βX − 0.5.
We model the optical suppression from the X-ray extrapolation assuming either a Milky Way (MW) or a Small Magellanic Cloud (SMC) extinction curve. We also test the attenuation curve obtained for a sample of starburst galaxies (Calzetti et al. 1994). We consider the upper limits as positive detections, and we verify that the model-predicted fluxes are consistent with the data, i.e. equal to or below the upper limits.
3.1. GRB 100614A
For this burst, the X-ray steep decay phase ends about 30 minutes after the trigger, while the plateau stops 2.27 days after the trigger. The reddest and deepest upper limits are those obtained 258 and 570 min after the trigger with the 10.4-m Gran Telescopio Canarias (GTC) in the ugriz photometric bands (Guizy et al. 2010) and with Gemini Near InfraRed Imager on the 8-m Gemini North telescope in the J and K bands (Cenko et al. 2010b), respectively (see Table 1). The data of the first observation were photometrically calibrated using the SDSS stars and the upper limits are at the 3σ confidence level (Guziy et al. 2010; Guziy, priv. comm.). The data of the second observation were calibrated using three 2MASS stars and are given at the 5σ confidence level. The RMS spread evaluated by comparing these data with calibrators is 0.1 (0.2) mag in the J(K) band (Cenko et al. 2010b; Cenko, priv. comm.). All the available magnitudes were corrected for Galactic reddening in the direction of this burst. The optical upper limits corresponding to the magnitudes of the first observation are the following (from the U to the z band): fU < 0.13,fg < 0.056, fr < 0.085, fi < 0.11, fz < 0.24 μJy. The optical upper limits corresponding to the J and K data points of the second observation are fJ < 1.3 μJy and fK < 1.5 μJy, respectively.
The 0.3–10 keV energy spectrum integrated between 10 ks and 100 ks after the trigger, that is during the plateau phase, is closely fitted by an absorbed power law with an equivalent hydrogen column density NH = (1.6 ± 0.7) × 1021 cm-2 beyond the Galactic one measured at the position of the X-ray afterglow (NH,Gal = 2.2 × 1020 cm-2, Kalberla et al. 2005) and a photon index of Γ = 2.5 ± 0.3 (90% confidence range). The count rate to unabsorbed flux conversion factor is 6 × 10-11 erg cm-2 cts-1.
The X-ray spectrum does not vary significantly during the plateau phase, thus we assume this spectral shape for the epochs at which we wish to extract the broad-band SEDs, and we compute the X-ray normalization level from the light curve at the given epochs. The count rate 258 and 570 min after the trigger is c1 = 0.03 counts s-1 and c2 = 0.02 counts s-1. Converting these values into unabsorbed flux using the conversion estimated factor, we find f1 = 1.8 × 10⁻¹² erg cm-2 s-1 and f2 = 1.2 × 10⁻¹² erg cm-2 s-1. The flux densities at 1.7 keV (logarithmic mean of the XRT energy range) are therefore fν1 = 0.10 and fν2 = 0.07 μJy 258 and 579 min after the trigger, respectively.
3.2. GRB 100615A
For this burst, the X-ray steep phase ends 185 s after the trigger, and the flat one about 5 ks later. The reddest observations for the GRB 100615A afterglow were performed in the K band 20 min (Nicuesa et al. 2010), 5.5 h (Cenko et al. 2010a), and 9.2 days (Perley et al. 2010) after the BAT trigger (see Table 1). The first observation falls during the plateau phase, while the last two take place during the normal phase. The magnitudes of the first observation are obtained using the GROND zero point and the 2MASS catalog, and are at the 3σ confidence level (Nicuesa et al. 2010). The data of the second observation are calibrated against three 2MASS stars and the upper limits are at the 5σ level. The RMS spread when comparing these data with calibrators is 0.2 in the K band (Cenko et al. 2010a, Cenko, priv. comm.). Finally, the data of the last observation are calibrated using two 2MASS stars and the upper limits are at the 3σ level. The calibration is accurate to 0.20 − 0.25 mag (Perley et al. 2010, Perley, priv. comm.). All these magnitudes were corrected for Galactic reddening in the direction of this burst. The optical upper limits corresponding to the magnitudes of the first observation are the following (from the g′ to the K band): fg′ < 1.0,fr′ < 1.0, fi′ < 2.3, fz′ < 2.8, fJ < 9.56, fH < 18.7, fK < 27.9 μJy. The optical upper limits corresponding to the K data points of the second and third observations are fK < 16.1 μJy and fK < 4.9 μJy, respectively.
The 0.3–10 keV energy spectrum was integrated during the plateau, the normal and the normal+plateau phases. In all cases, it could be closely fitted with an absorbed power law model. The photon indices and NH values are consistent in the three integration intervals, thus we assume as the most accurate estimates of the spectral parameters, those for the overall integration, which are Γ = 2.35 ± 0.15 and NH = (1.05 ± 0.12) × 1022 cm-2 beyond the Galactic value at the position of the X-ray afterglow (NHGal = 3.3 × 1020 cm-2, Kalberla et al. 2005), with a count rate to unabsorbed flux conversion factor of 1.5 × 10⁻¹⁰ erg cm-2 cts-1.
As for GRB 100614A, we assume this spectral shape for the broad-band SED analysis, computing the X-ray normalization level from the light curve at the give epochs. The count rate at the selected epochs is c1 = 1.0 cts/s, c2 = 0.2 counts s-1, and c3 = 0.005 counts s-1. Converting these values into unabsorbed flux using the conversion estimated factor, we find f1 = 1.5 × 10⁻¹⁰ erg cm-2 s-1, f2 = 3.0 × 10⁻¹¹ erg cm-2 s-1, and f3 = 7.5 × 10⁻¹³ erg cm-2 s-1. The flux densities at 1.7 keV (logarithmic mean of the XRT energy range) are therefore fν1 = 9.84, fν2 = 1.97, and fν3 = 0.013 μJy.
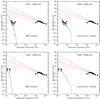 |
Fig. 2 GRB 100614A SEDs at two different epochs: GTC ugriz upper limits taken 4.3 h after the trigger (upper panels) and the NIR J and K band taken 9.5 h after the trigger (lower panels), with βOX fixed at βX − 0.5 (solid red line) and the optical suppression modeled with the MW or starburst extinction curves. Black dotted line represents the best-fit value for the X-ray spectral slope (βX = 1.50). Dashed red lines enclose the 90% uncertainty in βOX. |
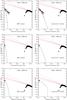 |
Fig. 3 GRB 100615A SEDs at three different epochs: GROND grizJHK upper limits taken 24 min after the trigger (upper panels) and Gemini-North K and Ks upper limits taken 5.5 h and 9.2 days after the trigger, respectively (middle and lower panels), with βOX fixed at βX − 0.5 and the optical suppression modeled with the MW or starburst extinction curves. Black dotted line represents the best-fit value for the X-ray spectral slope (βX = 1.35). Dashed red lines enclose the 90% uncertainty in βOX. |
4. Results
We find that GRB fluxes computed from both optical and NIR data are well below the most conservative extrapolation from X-rays and require strong absorption using the data taken within 1 day after the trigger. For GRB 100615A, very late-time data are available (9.2 days after the trigger), for which the NIR flux is still below the X-ray extrapolation.
The GRB 100614A SED with the reddest flux upper limit (i.e. 570 min after the trigger) requires a rest-frame V-band dust extinction of AV ≥ 47, 58, and 11 mag, assuming a MW, SMC, or a starburst extinction curve, respectively, and using the best-fit value for βX (Fig. 2). Even fixing the optical to X-ray energy spectral index to its lowest allowed value (within its 90% confidence range), that is, in the most conservative case, results still provide very high AV lower limits (Table 2). Less stringent constraints on AV are obtained using the GTC ugriz flux upper limits obtained 258 min after the trigger. We obtain AV ≥ 13 mag with either the MW and SMC extinction curve and AV ≥ 8 mag with the starburst case.
For GRB 100615A, we obtain even tighter lower limits. The SED extracted 24 min after the burst requires AV ≥ 64, 79, or 16 mag assuming either a MW or SMC extinction curve, or a starburst attenuation curve, respectively. These lower limits are still very high for the SED extracted 5.5 h post burst: AV ≥ 58, 72, and 15 mag for the three extinction recipes. Less critical but still high values, are obtained even 9.2 days from the burst: AV ≥ 22, 27, and 6 mag (Fig. 3). The latter lower limits are lower than the ones obtained at earlier epochs (but still extreme), possibly due to a selection effect, since at later times the X-ray flux decreases, but the optical/NIR upper limits can not become fainter consistently, owing to the instrument detection limits.
Table 2 reports all the AV lower limits evaluated from the GRB 100614A and GRB 100615A data, for MW, SMC, and starburst extinction laws at the given mean observation epochs. These lower limits are computed for the reported ranges of the X-ray spectral index (βX = Γ − 1, estimated in Sect. 3) that corresponds to the minimum, maximum, and mean value of the estimated 90% confidence range. Bold face characters indicate the results obtained with the most probable X-ray spectral index. Upper limits to the optical-to-X-ray spectral indices βOX are also shown.
Lower limits to the visual extinction towards GRB 100614A and GRB 100615A.
5. Discussion
We have analyzed two Swift “dark” GRBs, namely, GRB 100614A, and GRB 100615A. These GRBs are dark according to every definition proposed until now. They are not detected in the optical/NIR down to very faint limits, despite follow-up campaigns at ground-based facilities began a few minutes from the BAT triggers (see Table 1). In addition, their optical-to-X-ray spectral indices satisfy βOX < 0.5 (Jakobsson et al. 2004, criterion) and βOX < βX − 0.5 (van der Horst et al. 2009, criterion). The identification of these two GRBs as dark bursts according to the above-mentioned methods, is the consequence of their intense X-ray flux coupled to the optical/NIR missing detections. GRB 100614A (GRB 100615A) indeed falls in the upper 30% (5%) of the distribution of Swift/XRT GRB fluxes at 11 h from the burst (Gehrels et al. 2008).
The outcome of our analysis is surprising. To explain the deepest NIR upper limits (i.e. the less affected by dust) in terms of a flux suppression described by either a MW or SMC dust extinction laws, AV > 47 (AV > 58) mag is needed for GRB 100614A (GRB 100615A) before one day and AV > 22 at 9 days after the trigger for GRB 100615A. Such extreme AV values have never been observed before and require an explanation.
As an example, Perley et al. (2009) studied a sample of 29 Swift bursts rapidly observed by the Palomar 60-inch telescope (14 of which were classified as dark) from April 2005 to March 2008. From both optical to X-ray afterglow spectral analyses and host galaxy studies (applying the βOX < 0.5 criterion by Jakobsonn et al. 2004 and assuming in general a SMC extinction law), they find that more than half of the dark sample is extincted by dust, with three events featuring AV > 2−6 mag, two GRBs possibly being high redshift events (4.5 < z < 7), and three being underluminous events (not detected in the optical bands, but not dark according to Jakobsson et al. 2004, criterion). The dust extinction in their sample is compatible to that observed along the dustiest MW sightlines. Extinction values of AV ≤ 5 are found along more than 700 Galactic sightlines (Diplas & Savage 1994). In a handful of extreme cases, AV can be higher, up to ~20 (Predehl & Schmitt 1995). Rol et al. (2007) studied what they called a “prototype” dark GRB, namely, GRB 051022. This burst misses any optical/NIR detection, such as GRB 100614A and GRB 100615A, and is the darkest burst in the paper by van der Horst et al. (2009) according to their classification criterion. Applying our analysis to GRB 051022, we find AV > 16 and 20 mag assuming a MW and SMC extinction curve, respectively. Again, these values are well below the AV lower limits we need to fit the deepest NIR upper limits of GRB 100615A and GRB 100614A, using the same extinction curves.
While a SMC-like extinction curve can adequately fit a large fraction of the dust extinction from GRB host ISM, our present picture of GRB host galaxies makes an extremely obscured environment of this kind a very unlikely possibility. Indeed, GRBs, even reddened ones, are hosted by blue or normal galaxies, which are commonly detected in ordinary galaxy surveys. This favors a scenario of a host morphology where the line of sight to the GRB is dusty, i.e., dust obscures only localized regions (see e.g., Perley et al. 2009, and references therein). An in situ obscuration appears to be insufficient to be responsible for the extreme extinction levels we measure.
All these considerations hold if the optical radiation and X-rays are part of the same synchrotron spectrum. They could originate from different emission processes or even be produced in different, independent emission regions. This is possible in particular during the so-called “shallow phase”, where X-ray emission may be dominated by an emission component that differs from the one from which the optical flux originates (e.g. Zhang et al. 2006, for a review). Interesting hints about the early optical to X-ray afterglow spectral behavior came from Greiner et al. (2011). These authors addressed the darkness problem by studying all the GRBs observed by the GROND imager mounted on the 2.2 m MPI/ESO telescope at La Silla (Greiner et al. 2008). Broad-band SEDs of those GRBs with simultaneous optical and X-ray data within the first 240 minutes and after the early X-ray steep decay (43 GRBs, 39 of which are long) have been extracted and a simple or a broken power-law spectral model has been fitted to the data according to the darkness criterion of van der Horst et al. (2009). The optical to X-ray SEDs of those GRBs at known redshifts clearly show that in no case the optical fluxes are above the X-ray extrapolation, a signature that would have confirmed the possible distinct origin of the early X-ray emission from the optical one. In particular, modeling the optical suppression from the X-ray extrapolation as SMC- or MW-type dust extinction, Greiner et al. (2011) found in all cases a good agreement between the expected fireball spectral model and the data, and a fraction of 25% − 40% of the bursts of their sample were found to be dark (different percentages depend on the definition used), where their darkness can be explained by moderate extinction (0.5 < AV < 1.5), or high redshift (z > 5) for 22% of the dark bursts. These results show the lack of an evident inconsistency between the optical and X-ray early afterglow SED. However, the brightness of the X-ray flux may be biased by the possible presence of a dominant component that differs from the one responsible for the optical emission: excess of the X-ray to optical flux ratio could thus mimic a stronger optical absorption than the real one. Since the two SEDs of GRB 100614A, the first one of GRB 100615A, and (marginally) the second one of GRB 100615A are all extracted during the shallow phases of these GRBs, a different origin of the optical and X-ray emission in these epochs could at least in part explain the optical darkness of our GRBs. However, we note that for GRB 100615A we have extracted a SED at a very late time, about nine days after the end of the plateau phase, and we have still obtained very high AV lower limits (Av > 20) assuming either a MW or a SMC extinction curve. These values are less extreme than that obtained using the other SEDs, but still very high, suggesting another or at least a concurring mechanism to account for the GRB darkness.
This complementary explanation could be that local extinction recipes, such as MW or SMC ones are inadequate for reproducing the optical suppression in the host galaxies of these two GRBs. Indeed, the dust and extinction properties of GRB host galaxies are still poorly known. For example, modeling the dust absorption using greyer extinction laws, such as the attenuation curve obtained from the observations of starburst galaxies proposed by Calzetti (1994), brings GRB 100614A and GRB 100615A to require AV lower limits that are less extreme, despite still being very high. More gray extinction curves have already been invoked for GRB environments by several authors (e.g. Perley et al. 2009; Stratta et al. 2004, 2005; Chen et al. 2006; Li et al. 2008). The shape of the extinction curve provides information on the dust properties. The study of dust in GRB environments is particularly useful for studying any evolution of dust properties and dust production mechanisms up to very high redshifts and in “normal” galaxies. The latters are indeed more representative of the majority of the galaxy population, rather than the more extreme galaxies, such as those hosting quasars.
A mixture of moderate-to-high redshift and extinction can reduce the dust level necessary to explain the SEDs. In Fig. 4, we plot as an example the AV values as a function of z obtained for the second epoch of GRB 100615A observations. Although the visual extinction is considerably lower than for the z = 0 case, AV ~ 10 at z = 2 and AV ~ 4 − 5 at z = 5 is still required, regardless of the adopted extinction recipe. Kann et al. (2010) reported the computed rest-frame AV values for a vast sample of GRBs with known redshift (see their Fig. 3). All GRBs in that sample are modeled with AV ≤ 1.3. Similar results are obtained by Greiner et al. (2011) whose SEDs of GBRs at known redshift are modeled with AV ≤ 1.5. We stress that GRB samples with known redshift are usually biased towards non-absorbed GRBs, and the comparison between their AV and that of our sources must then be taken with caution. However, the Greiner et al. (2011) sample is more than 90% complete, since only 3 out of the 39 long GRBs observed by GROND miss a redshift estimation. Although our AV lower limits in this scenario are well above those estimated for the Kann et al. (2010) and Greiner et al. (2011) samples, they are not extremely unlikely. Thus, an intrinsic origin and/or dust extinction, coupled to a moderately high redshift could explain the darkness of GRB 100614A and 15A.
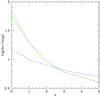 |
Fig. 4 The visual extinction AV as a function of redshift for the second epoch SED of GRB 100615A. Green solid, red dotted, and blue dashed lines are for the Milky Way, Small Magellanic Cloud, and starburst extinction recipes, respectively. |
A more exotic but intriguing possibility would be that these GRBs are extremely high redshift events. Assuming that the lack of any detection in the reddest NIR band (K-band) is due to Lyα absorption from the intergalactic hydrogen neutral fraction, we can set a redshift lower limit of z > 17. The first population of very massive stars (PopIII, 102 M⊙ < M < 103 M⊙) is expected to form at z ~ 20. Their death is supposed to leave behind black holes of several tens of solar masses, which could be the early progenitors of active galactic nuclei. These fast-spinning black holes have a rotational energy of ~1055 erg or more that can power a GRB explosion (see e.g., Komissarov & Barkov 2010; Mészáros & Rees 2010; Suwa & Yoka 2011). The isotropic energies of GRB 100614A and GRB 100615A can be estimated from their BAT fluence (Sakamoto et al. 2010; Palmer et al. 2010). The resulting values assuming z = 18 are 1.3 × 1054 erg and 7.2 × 1053 erg, respectively. Such energies fall in the bright tail of the GRB distribution, the most energetic burst detected to date, GRB 080916C, having Eiso = 9 × 1054 erg (Abdo et al. 2009). The Amati relation (Amati et al. 2008) allows for a 2σ scattering of the prompt emission energy peak of 0.5 − 5 MeV in the rest frame, assuming an isotropic energy of ~ 1054 erg. The reported isotropic energies must be considered as lower limits both because of the conservative choice of the z used and because the BAT detector does not constrain the position of the peak emission preventing a bolometric estimate of the emitted energy. Thus, that these peaks are not required in the 15–150 keV spectral fit of the GRB 100614A and GRB 100615A BAT data (Sakamoto et al. 2010; Palmer et al. 2010) is not surprising. In addition, according to some models (see e.g., Suwa & Yoka 2011), a considerable fraction of the available energy to produce the GRB must be used to pierce the envelope of the very massive star. The lack of detection of any host galaxy candidate for these GRBs represents additional support of this scenario. On the other hand, against the high redshift interpretation there is that the expected GRB rate at z > 17 is extremely low, between 0.5 and 1 GRB every 10 yr (Bromm & Loeb 2006). In addition, there is the non-negligible equivalent hydrogen column density value measured for GRB 100614A and GRB 100615A from X-ray spectroscopy. For example, at z = 18, the rest-frame column density would be roughly (1 + z)8/3 times higher than the measured value, thus ~300−3000 × 1022 cm-2 for our GRBs. These high hydrogen column densities would require an extremely dense environment surrounding the GRB, which challenges this scenario.
A possible way to differentiate between extremely high-redshift, exotic extinction recipes and emission from distinct components for sources such as these, would be to search for the afterglow in the mid- or far-IR bands. A non-detection also in these bands could hardly be explained using any extinction law and would definitely rule out a high redshift origin. A multiband detection compatible with the X-ray flux at late times (e.g. > 105 s after the trigger, i.e. after the end of the “shallow phase”) would instead favor the fireball model. In this case, given the lack of NIR detections, the origin of the darkness would be in exotic extinction or high redshift, depending on the spectral shape in the mid- and far-IR bands.
Acknowledgments
This work made use of data supplied by the UK Swift Science Data Centre at the University of Leicester. We are indebted to S. Guziy, S.B. Cenko, and D.A. Perley for providing us with details on the analysis performed in their GCNs.
References
- Abdo, A. A., Ackermann, M., Arimoto, M., et al. 2009, Science, 323, 1688 [Google Scholar]
- Amati, L., Guidorzi, C., Frontera, F., et al. 2008, MNRAS, 391, 557 [Google Scholar]
- Bromm, G., & Loeb, A. 2006, ApJ, 642, 382 [Google Scholar]
- Burrows, D. N., Hill, J. E., Nousek, J. A., et al. 2005, SSR, 120, 165 [Google Scholar]
- Butler, N. R., Perley, D. A., Cenko, S. B., et al. 2010, GCNcirc, 10915 [Google Scholar]
- Calzetti, D., Kinney, A. L., & Storchi-Bergmann, T. 1994, ApJ, 429, 582 [NASA ADS] [CrossRef] [Google Scholar]
- Cenko, S. B., Perley, D. A., Tanvir, N. R., et al. 2010a, GCNcirc, 10861, 1 [Google Scholar]
- Cenko, S. B., Perley, D. A., Tanvir, N. R., et al. 2010b, GCNcirc, 10862, 1 [Google Scholar]
- Chen, S. L., Li, A., & Wei, D. M. 2006, ApJ, 647, L13 [NASA ADS] [CrossRef] [Google Scholar]
- Dai, Z. G., & Cheng, K. S. 2001, ApJ, 558, L109 [NASA ADS] [CrossRef] [Google Scholar]
- D’Elia, V., Barthelmy, S. D., Baumgartner, W. H., et al. 2010, GCNCirc, 10841, 1 [NASA ADS] [Google Scholar]
- Diplas, A., & Savage, B. D. 1994, ApJ, 427, 274 [NASA ADS] [CrossRef] [Google Scholar]
- Dhillon, V., Mignani, R., Schulze, S., et al. 2010, GCNCirc, 10842 [Google Scholar]
- Fynbo, J. U., Jensen, B. L., Gorosabel, J., et al. 2001, A&A, 369, 373 [NASA ADS] [CrossRef] [EDP Sciences] [Google Scholar]
- Gehrels, N., Chincarini, G., Giommi, P., et al. 2004, ApJ, 621, 558 [Google Scholar]
- Gehrels, N., Barthelmy, S. D., Burrows, D. N., et al. 2008, ApJ, 689, 1161 [NASA ADS] [CrossRef] [Google Scholar]
- Groot, P. J., Galama, T. J., van Paradijs, J., et al. 1998, ApJ, 493, L27 [NASA ADS] [CrossRef] [Google Scholar]
- Greiner, J., Bornemann, W., Clemens, T., et al. 2008, PASP, 120, 205 [Google Scholar]
- Greiner, J., Krüler, S., Klose, S., et al. 2011, A&A, 526, 30 [Google Scholar]
- Guziy, S., Jelinek, M., Gorosabel, J., et al. 2010, GCNCirc, 10967 [Google Scholar]
- Jakobsson, P., Hjorth, J., Fynbo, J. P. U., et al. 2004, ApJ, 617, L21 [NASA ADS] [CrossRef] [Google Scholar]
- Jakobsson, P., Malesani, D., Hjorth, J., Fynbo, J. P. U., & Milvang-Jansen, B. 2011, AN, in press [Google Scholar]
- Jelinek, M., Castro-Tirado, A. J., Kubanek, P., & de Ugarte Postigo, A. 2010, GCNCirc, 10839 [Google Scholar]
- Kalberla, P. M. W., Burton, W. B., Hartmann, D., et al. 2005, A&A, 440, 775 [NASA ADS] [CrossRef] [EDP Sciences] [Google Scholar]
- Kann, D. A., Klose, S., Zhang, B., et al. 2010, ApJ, 720, 1513 [NASA ADS] [CrossRef] [Google Scholar]
- Komissarov, S. S., & Barkov, M. V. 2010, MNRAS, 402, L25 [NASA ADS] [Google Scholar]
- Lazzati, D., Covino, S., & Ghisellini, G. 2002, MNRAS, 330, 583 [NASA ADS] [CrossRef] [Google Scholar]
- Levan, A. J., Tanvir, N. R., Groot, P., et al. 2010, GCNCirc, 10840 [Google Scholar]
- Li, A., Liang, S. L., Kann, D. A., et al. 2008, ApJ, 685, 1046 [NASA ADS] [CrossRef] [Google Scholar]
- Liang, E.-W., Lü, H.-J., Hou, S.-J., Zhang, B.-B., & Zhang, B. 2009, ApJ, 707, L328 [NASA ADS] [CrossRef] [Google Scholar]
- Malesani, D., Xu, D., Pursimo, T., & Jakobsson, P. 2010, GCNcirc, 10854 [Google Scholar]
- Margutti, R., Sbarufatti, B., & D’Elia, V. 2010, GCNcirc, 10847 [Google Scholar]
- Mészáros, P., & Rees, M. J. 1997, ApJ, 476, 232 [NASA ADS] [CrossRef] [Google Scholar]
- Mészáros, P., & Rees, M. J. 2010, ApJ, 715, 967 [NASA ADS] [CrossRef] [Google Scholar]
- Morgan, A. N., Klein, C. R., & Bloom, J. S. 2010, GCNcirc, 10843 [Google Scholar]
- Mundell, C. G., & Steele, I. A. 2010, GCNCirc, 10838 [Google Scholar]
- Nicuesa, A., Klose, S., Greiner, J., et al. 2010, GCNcirc, 10844 [Google Scholar]
- Nousek, J. A., Kouveliotou, C., Grupe, D., et al. 2006, ApJ, 642, 389 [NASA ADS] [CrossRef] [Google Scholar]
- Osborne, D. M., Beardmore, A. P., Evans, P. A., & Goad, M. R. 2010, GCNcirc, 10849 [Google Scholar]
- Palmer, D. M., Barthelmy, S. D., Baumgartner, W. H., et al. 2010, GCNcirc, 10850 [Google Scholar]
- Perley, D. A., Cenko, S. B., Bloom, J. S., et al. 2009, AJ, 138, 1690 [NASA ADS] [CrossRef] [Google Scholar]
- Perley, D. A., Bloom, J. S., Cenko, S. B., & Butler, N. R. 2010, GCNcirc, 10928 [Google Scholar]
- Predehl, P., & Schmitt, J. H. M. M. 1995, A&A, 293, 889 [NASA ADS] [Google Scholar]
- Rol, E., Wijers, R. A. M. J., Kouveliotou, C., Kaper, L., & Kaneko, Y. 2005, ApJ, 624, 828 [Google Scholar]
- Roming, P. W. A., & Mason, K. O. 2006, in Gamma-Ray Bursts in the Swift Era, Washington, Dec. 2005, ed. S. S. Holt, N. Gehrels, & J. A. Nousek, AIP Conf. Proc., 836, 224 [Google Scholar]
- Roming, P. W. A., Kennedy, T. E., Mason, K. O., et al. 2005, SSR, 120, 95 [Google Scholar]
- Sakamoto, T., Barthelmy, S. D., Baumgartner, W. H., et al. 2010, GCNcirc, 10852 [Google Scholar]
- Sari, R., Piran, T., & Narayan, R. 1998, ApJ, 497, L17 [NASA ADS] [CrossRef] [Google Scholar]
- Schartel, N. 2010, GCNCirc, 10845 [Google Scholar]
- Shakhovskoy, V., Rumyantsev, V., & Pozanenko, A. 2010, GCNCirc, 10893 [Google Scholar]
- Starling, R. L. C., van der Horst, A. J., Rol, E., et al. 2008, 672, 433 [Google Scholar]
- Stratta, G., Fiore, F., Antonelli, L. A., Piro, L., & De Pasquale, M. 2004, ApJ, 608, 846 [NASA ADS] [CrossRef] [Google Scholar]
- Stratta, G., Perna, R., Lazzati, D., et al. 2005, A&A, 441, 83 [NASA ADS] [CrossRef] [EDP Sciences] [Google Scholar]
- Stratta, G., Barthelmy, S. D., Baumgartner, W. H., et al. 2010, GCNCirc, 10837 [Google Scholar]
- Suwa, Y., & Ioka, K. 2011, ApJ, 726, 107 [NASA ADS] [CrossRef] [Google Scholar]
- van der Horst, A. J., Kouveliotou, C., Gehrels, N., et al. 2009, ApJ, 699, 1087 [NASA ADS] [CrossRef] [Google Scholar]
- van Paradijs, J., Groot, P. J., Galama, T., et al. 1997, Nature, 386, 686 [NASA ADS] [CrossRef] [Google Scholar]
- Wijers, R. A. M. J., Rees, M. J., & Mészáros, P. 1997, MNRAS, 288, L51 [NASA ADS] [CrossRef] [Google Scholar]
- Zhang, B. 2007, ChJAA, 7, 1 [Google Scholar]
All Tables
All Figures
|
Fig. 1 GRB 100614A (upper panel) and GRB 100615A (bottom panel) X-ray lightcurves, together with all the optical/NIR upper limits estimated using several ground-based facilities (see Table 1 for details). Cyan, blue, magenta, green, yellow, black and red upper limits represents the g′ (and all those bands bluer than g′), R, I, z, J, H, K bands, respectively. Vertical dashed lines emphasize the reddest observations and the time at which they have been obtained. Such observations are used in our analysis. The faintest X-ray data in the bottom panel draws the GRB 100615A Chandra observation (Butler et al. 2010). |
| In the text | |
|
Fig. 2 GRB 100614A SEDs at two different epochs: GTC ugriz upper limits taken 4.3 h after the trigger (upper panels) and the NIR J and K band taken 9.5 h after the trigger (lower panels), with βOX fixed at βX − 0.5 (solid red line) and the optical suppression modeled with the MW or starburst extinction curves. Black dotted line represents the best-fit value for the X-ray spectral slope (βX = 1.50). Dashed red lines enclose the 90% uncertainty in βOX. |
| In the text | |
|
Fig. 3 GRB 100615A SEDs at three different epochs: GROND grizJHK upper limits taken 24 min after the trigger (upper panels) and Gemini-North K and Ks upper limits taken 5.5 h and 9.2 days after the trigger, respectively (middle and lower panels), with βOX fixed at βX − 0.5 and the optical suppression modeled with the MW or starburst extinction curves. Black dotted line represents the best-fit value for the X-ray spectral slope (βX = 1.35). Dashed red lines enclose the 90% uncertainty in βOX. |
| In the text | |
|
Fig. 4 The visual extinction AV as a function of redshift for the second epoch SED of GRB 100615A. Green solid, red dotted, and blue dashed lines are for the Milky Way, Small Magellanic Cloud, and starburst extinction recipes, respectively. |
| In the text | |
Current usage metrics show cumulative count of Article Views (full-text article views including HTML views, PDF and ePub downloads, according to the available data) and Abstracts Views on Vision4Press platform.
Data correspond to usage on the plateform after 2015. The current usage metrics is available 48-96 hours after online publication and is updated daily on week days.
Initial download of the metrics may take a while.