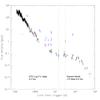
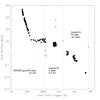
Fig. 1

GRB 100614A (upper panel) and GRB 100615A (bottom panel) X-ray lightcurves, together with all the optical/NIR upper limits estimated using several ground-based facilities (see Table 1 for details). Cyan, blue, magenta, green, yellow, black and red upper limits represents the g′ (and all those bands bluer than g′), R, I, z, J, H, K bands, respectively. Vertical dashed lines emphasize the reddest observations and the time at which they have been obtained. Such observations are used in our analysis. The faintest X-ray data in the bottom panel draws the GRB 100615A Chandra observation (Butler et al. 2010).
Current usage metrics show cumulative count of Article Views (full-text article views including HTML views, PDF and ePub downloads, according to the available data) and Abstracts Views on Vision4Press platform.
Data correspond to usage on the plateform after 2015. The current usage metrics is available 48-96 hours after online publication and is updated daily on week days.
Initial download of the metrics may take a while.