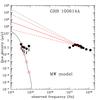
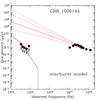
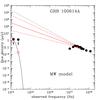
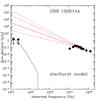
Fig. 2

GRB 100614A SEDs at two different epochs: GTC ugriz upper limits taken 4.3 h after the trigger (upper panels) and the NIR J and K band taken 9.5 h after the trigger (lower panels), with βOX fixed at βX − 0.5 (solid red line) and the optical suppression modeled with the MW or starburst extinction curves. Black dotted line represents the best-fit value for the X-ray spectral slope (βX = 1.50). Dashed red lines enclose the 90% uncertainty in βOX.
Current usage metrics show cumulative count of Article Views (full-text article views including HTML views, PDF and ePub downloads, according to the available data) and Abstracts Views on Vision4Press platform.
Data correspond to usage on the plateform after 2015. The current usage metrics is available 48-96 hours after online publication and is updated daily on week days.
Initial download of the metrics may take a while.