Fig. 5
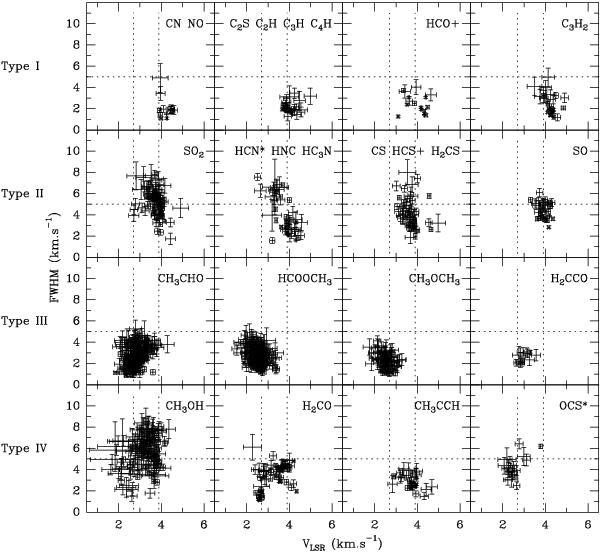
Plots of the rest velocity vLSR versus the FWHM, derived from the Gaussian fits of the lines (Table 5). All the detected species and the relevant isotopologues of Table 5 are plotted, except those in which the lines have obviously non-Gaussian profiles (see text). In particular, the labels HCN* and OCS* mean that the main isotopologues of these species are not included, because of their non-Gaussian profiles. The one-σ error bars include fit and spectral resolution uncertainties. The vertical lines at vLSR = 2.7 and 3.9 km s-1 correspond to the velocity of the components B and A, respectively (see Sect. 6). The horizontal line at 5 km s-1 corresponds approximatively to the average of the line FWHM range.
Current usage metrics show cumulative count of Article Views (full-text article views including HTML views, PDF and ePub downloads, according to the available data) and Abstracts Views on Vision4Press platform.
Data correspond to usage on the plateform after 2015. The current usage metrics is available 48-96 hours after online publication and is updated daily on week days.
Initial download of the metrics may take a while.