| Issue |
A&A
Volume 531, July 2011
|
|
|---|---|---|
| Article Number | A99 | |
| Number of page(s) | 9 | |
| Section | Extragalactic astronomy | |
| DOI | https://doi.org/10.1051/0004-6361/201116867 | |
| Published online | 21 June 2011 | |
On the size-luminosity relation of AGN dust tori in the mid-infrared⋆
1
Max-Planck-Institut für Radioastronomie,
Auf dem Hügel 69,
53121
Bonn,
Germany
e-mail: This email address is being protected from spambots. You need JavaScript enabled to view it.
2
Max-Planck-Institut für extraterrestrische Physik,
Giessenbachstraße, 85748
Garching,
Germany
e-mail: This email address is being protected from spambots. You need JavaScript enabled to view it.
3
Universitäts-Sternwarte München, Scheinerstrasse 1, 81679
München,
Germany
Received: 11 March 2011
Accepted: 28 April 2011
Abstract
Context. Interferometric measurements in the mid-infrared have shown that the sizes of the warm dust distributions in active galactic nuclei (AGN) are consistent with their scaling with the square root of their luminosity.
Aims. We carry out a more detailed analysis of this size-luminosity relation to investigate which of the general properties of the dusty tori in AGN can be derived from this relation. We are especially interested in the cases, where only a very small number of interferometric measurements are available and the sizes are directly calculated from the measured visibilities assuming a Gaussian brightness distribution.
Methods. We improve the accuracy of the size-luminosity relation by adding a few additional size measurements from more recent interferometric observations and compare the measured sizes to those derived from hydrodynamical and radiative transfer models of AGN tori.
Results. We find that a Gaussian approximation yields a reasonable estimate of the size of the brightness distribution, as long as the visibilities are within 0.2 ≤ V ≤ 0.9. The uncertainty in the size estimate depends on the true brightness distribution and is up to a factor of four for the models used in our investigation. The size estimates derived from the models are consistent with those determined from the measurements. However, the models predict a significant offset between the sizes derived for face-on (Seyfert 1 case) and edge-on (Seyfert 2 case) tori: the face-on tori should appear significantly more compact for the same luminosity. This offset is not observed in the current data, probably because of the large uncertainties and low statistics of the present interferometric measurements. Furthermore, we find a ratio of the mid- to near-infrared sizes of approximately 30, whereas the first probes the body of the torus and the second is an estimate of the inner rim.
Conclusions. The size-luminosity relation of AGN tori using Gaussian size estimates is a very simple and effective tool to investigate the internal structure and geometry of AGN tori and obtain constraints on the differences between type 1 and type 2 AGN. However, to fully exploit the possibilities of investigating the nuclear distributions of gas and dust in AGN using this size-luminosity relation, more accurate interferometric measurements of a larger sample of AGN are needed.
Key words: galaxies: active / galaxies: nuclei / galaxies: Seyfert / techniques: interferometric
Based on observations with MIDI at the European Southern Observatory, Chile, programme numbers 060.A-9224(A), 074.B-0213(B), 075.B-0697(B), 076.B-0038(A), 076.B-0743(A,C), 077.B-0026(B), 078.B-0031(A), 079.B-0180(A), 080.B-0258(A), 081.D-0092(A) and 381.B-0240(A,B).
© ESO, 2011
1. Introduction
A toroidal distribution of warm gas and dust is a key component of active galactic nuclei (AGN). In unified schemes of AGN (e.g. Antonucci 1993), this so-called dusty torus provides the viewing angle dependent obscuration of the central engine of AGN as well as the material for feeding the supermassive black hole. The dusty torus absorbs the hard continuum emission from the accretion disk and reemits it in the infrared. This direct connection between the emission from the accretion disk and the reprocessed emission from the torus is reflected by the tight correlation between the X-ray and the mid-infrared luminosities for both Seyfert 1 and Seyfert 2 galaxies (e.g. Horst et al. 2008; Gandhi et al. 2009; Levenson et al. 2009).
It was realised quite early that the nuclear dust is most likely distributed in clumps (Krolik & Begelman 1988). However, because of a lack of computational power as well as of suitable radiative transfer codes, a first attempt to model clumpy dust distributions in AGN was only undertaken by Nenkova et al. in 2002. Subsequent modelling of clumpy tori was carried out by Hönig et al. (2006), Nenkova et al. (2008a,b), Schartmann et al. (2008, 2009, 2010), and Hönig & Kishimoto (2010).
Observationally, interferometry in the near- and the mid-infrared led to a breakthrough in the investigation of dusty tori by being able to resolve the nuclear infrared emission of the warm dust. Using interferometric methods, it is now possible to directly study the physical properties of the nuclear dust distributions in several AGN and compare models of the torus with spatial information on its infrared emission. Interferometric studies of individual sources have been published for NGC 4151 (Swain et al. 2003; Burtscher et al. 2009; Pott et al. 2010), NGC 1068 (Wittkowski et al. 2004; Jaffe et al. 2004; Poncelet et al. 2006; Raban et al. 2009), Centaurus A (Meisenheimer et al. 2007; Burtscher et al. 2010), the Circinus galaxy (Tristram et al. 2007), and NGC 3783 (Beckert et al. 2008). First attempts have been undertaken to study several sources in a more generic way and to derive the general properties of the dust distributions. In Kishimoto et al. (2009a), a possible common radial structure for the dust distribution in Seyfert 1 nuclei was proposed, while in (Kishimoto et al. 2009b, 2011), the hot inner rim of the dust distribution was probed for several type 1 AGN (among them NGC 4151). In Tristram et al. (2009), mid-infrared interferometry of several type 1 and type 2 AGN is presented and the discovery of a size-luminosity relation has been claimed for the dust distributions in the mid-infrared: at 12 μm, the size s of the torus was found to be consistent to scale with the monochromatic luminosity L as s = p·L0.5 and the proportionality factor of the relation was determined as p = (1.8 ± 0.3) × 10-18 pc W-0.5.
This paper presents a follow-up study of this size-luminosity relation by including new data and by comparison of the measured relation to the predictions of hydrodynamic and radiative transfer models of AGN tori. The aim is to investigate the degree to which simple size estimates assuming Gaussian brightness distributions can be used to constrain torus models and investigate the torus structure.
The paper is organised as follows. In Sect. 2 the data used to determine the sizes of the dust distributions and the AGN luminosity are described. In Sect. 3, the models used for a comparison to the data are presented. The results and their discussion are found in Sect. 4 and our conclusions are given in Sect. 5.
Galaxy properties and characteristics derived from the interferometric observations of the AGN studied by MIDI.
2. Data
The data used to determine the size-luminosity relation was obtained with the MID-infrared Interferometric instrument (MIDI) at the Very Large Telescope Interferometer (VLTI) using the 8.2 m Unit Telescopes (UTs) of the array. Most of these were previously presented in Tristram et al. (2009). Additional data from more recent MIDI observations of NGC 4151, Mrk 1239, MCG-05-23-016, and IC 4329A were included in the present analysis to obtain a larger statistical sample of size estimates for these five sources. The new data was processed in exactly the same way as the original data and we refer to Tristram et al. (2009) for a description of the data reduction procedures and settings. Only for the second measurement of 3C 273 on 2008 Apr. 22 (mJD = 54 578.286) was the reduction carried out with a slightly modified mask. However, this leads only to an insignificant change in the resulting fluxes of this source. A detailed analysis and modelling of the interferometric data for NGC 4151 can be found in Burtscher et al. (2009). A full presentation and analysis of the new data for MCG-05-23-016, Mrk 1239, and IC 4329A will be presented elsewhere.
As in Tristram et al. (2009), the sizes of the dust emitters are estimated by assuming a Gaussian brightness distribution. Although the true brightness distributions of AGN tori are significantly more complex than a Gaussian brightness distribution, a Gaussian is the simplest and most general initial guess for the true brightness distribution and allows a very straightforward determination of the spatial extent of the source. The full width at half maximum FWHM(λ) of the Gaussian brightness distribution can be directly calculated from the visibility V(λ) and the projected baseline length BL of the interferometric observation according to 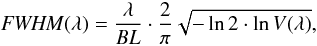 (1)where λ is the wavelength at which the calculation is carried out and FWHM is in radians. For the present investigation, we follow Tristram et al. (2009) and adopt λ = 12 μm. At this wavelength, changes in the atmospheric transmission are the smallest of all wavelengths measured by MIDI. At the same time the size estimate is least affected by spectral features (i.e. by either the silicate feature or line emission). As long as 0.2 ≲ V ≲ 0.9, the FWHM derived in this way is a good estimate of the emission region size. Otherwise only upper or lower limits to the size can be given. The sizes derived by this simple method agree with those determined from a more detailed modelling of the sources in the cases of NGC 1068 (1 pc < s < 4 pc, Raban et al. 2009), the Circinus galaxy (0.4 pc < s < 2 pc, Tristram et al. 2007), and NGC 4151 (s = 2.0 ± 0.4 pc, Burtscher et al. 2009). A more detailed discussion of the accuracy of this simple size estimate will be given in Sect. 3.3.
The mid-infrared luminosities, LMIR, are directly calculated from the mid-infrared fluxes measured with MIDI, and hence they have very large errors. The accuracies of both the luminosities as well as the visibilities (and hence also the size estimates) are limited by the large uncertainties in the total fluxes measured with MIDI. These uncertainties are caused by the insufficient removal of background emission from the long optical train through the delay lines by the chopping (cf. Absil et al. 2004). Owing to the non-linear form of Eq. (1), the errors in the size estimates are calculated independently from the upper or lower limits to the visibility.
In addition to the mid-infrared data, we compile luminosities derived from hard X-ray measurements for our sample of AGN. When corrected for foreground and intrinsic absorption, the X-ray luminosity is considered to be an effective proxy of the emission from the accretion disk, that is, of the intrinsic AGN luminosity. To obtain a preferably homogeneous set of values, most of the X-ray luminosities were taken from the first 22 months of data of the hard X-ray survey (14−195 keV) with the Burst Alert Telescope (BAT) on the Swift satellite (Tueller et al. 2010). These measurements were obtained before or contemporaneous with the interferometric measurements. We do not use the data for the 54-month release of the hard X-ray survey with BAT (Cusumano et al. 2010), because most of these data were obtained after our interferometric measurements. We nevertheless use the discrepancies between the 22-month and 54-month catalogues of BAT data to estimate the general uncertainty in the X-ray luminosities and find them to be of approximately 0.2 dex. This also takes into account a possible (moderate) variability of the sources. Only one of our sources, Mrk 1239, is not in the catalogue of sources from Tueller et al. (2010), hence we use the luminosity from Grupe et al. (2004), log (L0.2−12.0 keV/W) = 37.29 for this galaxy. Correction from the soft to the hard X-ray band using the factor of 1.81 from Rigby et al. (2009) with an additional correction for the different soft X-ray bands assuming a flat power law finally gives an estimate for the intrinsic luminosity of LX = 3.5 × 1037 W.
Three of our sources, NGC 1068, NGC 1365, and the Circinus galaxy, are significantly absorbed. Using the hydrogen column densities NH > 1.0 × 1025 cm-2 (Matt et al. 2000), NH = 4.0 × 1023 cm-2 (Risaliti et al. 2005), and NH = 4.3 × 1024 cm-2 (Matt et al. 2000) as well as the ratios of emergent to input hard X-ray fluxes from Rigby et al. (2009), we obtain correction factors of > 16, 1.2, and 3.6 for the three galaxies, respectively. These are applied to the measured luminosities to obtain the intrinsic luminosities. For all other galaxies, the corrections due to extinction along the line of sight are negligible.
All quantities (luminosities, baseline lengths, visibilities, and size estimates) as well as the general properties of the galaxies are summarised in Table 1.
3. Modelling
To gain a clearer understanding of the implications of the interferometrically measured sizes of the dust distributions, the size-luminosity relation of dusty tori is compared to the predictions from models for clumpy tori of AGN. We use two completely different modelling approaches in the comparison to distinguish the features that are characteristic of a certain model from more general properties of the dust distributions. We interpret all results common to both models as an indication that these results do not depend on the precise parameters of the respective model but rather are intrinsic properties of a geometrically thick, toroidal dust distribution.
3.1. Full hydrodynamical torus model
The first model is the full hydrodynamical simulation of dusty tori in AGN from Schartmann et al. (2009). This model accounts for both the obscuration, as well as the feeding, of the central source. The model follows the evolution of the interstellar medium by taking into account discrete mass-loss and energy injection due to the evolution of a nuclear star cluster, as well as optically thin radiative cooling. The interplay between the injection of mass, supernova explosions, and radiative cooling leads to a two-component structure consisting of a cold geometrically thin, but optically thick and very turbulent disk residing in the vicinity of the angular momentum barrier. The disk is surrounded by a filamentary toroidal structure on scales of tens of parsec. After the computationally very expensive hydrodynamical simulations have been calculated, radiative transfer simulations are carried out to obtain observable quantities such as surface brightness distributions and spectral energy distributions (SEDs). For the present comparison, we use the standard model from Schartmann et al. (2009) with a bolometric luminosity for the accretion disk of LAD = 1.2 × 10¹¹ L⊙ = 4.6 × 1037 W, which is meant to represent a typical Seyfert galaxy. Images of the brightness distributions at 12 μm for the Seyfert 1 (face-on) and Seyfert 2 (edge-on) cases of this model are shown in the top row of Fig. 1. For a more detailed description of the hydrodynamical simulation as well as the subsequent radiative transfer calculations, the reader is referred to Schartmann et al. (2009).
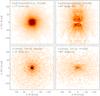 |
Fig. 1 Images of the torus models at 12 μm as used for our size determinations. Top row: full hydrodynamical torus model (Sect. 3.1); bottom row: clumpy torus model (Sect. 3.2); left panels: Seyfert 1 (i = 0°) case; right panels: Seyfert 2 (i = 90°) case. For the example images shown here, a bolometric luminosity of LAD = 4.6 × 1037 W and a distance of D = 45 Mpc were used for both models, in order to reach comparable sizes and intensities. All images are plotted with the same intensity range and a square root colour scale. |
3.2. Clumpy torus models
The second torus model compared with the data is the model of Hönig & Kishimoto (2010), which is an upgrade to the original 3D radiative transfer model of clumpy dust tori presented in Hönig et al. (2006). The strategy of this model is based on separating the simulations of individual cloud SEDs and images, and the final SEDs and images of the torus. In a first step, Monte Carlo radiative transfer simulations are used to calculate the emission from individual clouds at different distances from the centre. To finally simulate the entire torus emission, dust clouds are randomly distributed around an AGN according to certain physical and geometrical model parameters (for details see Hönig & Kishimoto 2010). Here we use the model with the “spherical” distribution of clouds in the vertical direction. The six parameters used for the description of the entire torus geometry are: (1) the radial dust-cloud distribution power-law index a; (2) the half-opening angle θ0; (3) the number of clouds along an equatorial line-of-sight N0; (4) the cloud radius at the sublimation radius Rcl; (5) the power-law index b of the cloud sizes; and (6) the outer torus radius Rout. The inner torus radius, i.e., the sublimation radius Rsub, is defined by the bolometric luminosity of the accretion disk, such that Rsub = 1.1·(LAD/1039 W)0.5 pc. The parameter values used for the present model were derived from the analysis of high resolution SEDs of Seyfert galaxies (Hönig et al. 2010) and are summarised in Table 2. Edge-on and face-on images of this torus model, for the same luminosity as the hydrodynamical model, are displayed in the bottom row of Fig. 1.
Parameters of the clumpy torus model used for the present modelling.
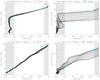 |
Fig. 2 Estimated physical torus size as a function of the visibility at 12 μm for the two torus models. Top row: full hydrodynamical torus model (Sect. 3.1); bottom row: clumpy torus model (Sect. 3.2); left panels: Seyfert 1 (i = 0°) case; right panels: Seyfert 2 (i = 90°) case. Different lines in the plots correspond to baseline orientations at different position angles. The maximum range of sizes defined by the interval 0.2 < V < 0.9 is marked by the blue lines and dots. The excluded visibilities are shaded in grey. |
3.3. Size estimates for the torus models
To obtain torus sizes that can be directly compared to the size estimates from the interferometric measurements, we simulate interferometric observations of the brightness distributions of the two models. To this end, we calculate the normalised Fourier transform of the model images at 12 μm and then extract visibilities at different baseline lengths for different position angles. This implies that the single-dish flux measured by MIDI using the 8.2 m UTs corresponds to the flux integrated over the entire torus model. This agrees with the emission from the AGN heated cores of almost all AGN appearing essentially unresolved in the mid-infrared on 8 m class telescopes (e.g. Horst et al. 2009).
We derive sizes for all model visibilities with 0.2 < V < 0.9 assuming a Gaussian brightness distribution by employing Eq. (1), consistent with the procedure used for the measured visibilities obtained with MIDI. Since we are interested in the intrinsic uncertainties in the size estimate due to the Gaussian approximation of the torus brightness distribution, we do not simulate errors in the visibilities.
The distance D at which the modelled tori reside is irrelevant because the spatial frequency in the Fourier domain scales inversely to the angular size. To observe the same visibilities for a more distant (i.e. smaller) torus of the same physical size, simply longer baseline lengths have to be used since s = D·FWHM ∝ D/BL. In practice, only a subrange of baseline lengths can be observed with the VLTI (or any real interferometer), so that only a part or none (e.g. if the source is unresolved even for the longest available baselines) of the 0.2 < V < 0.9 visibility range can be covered by observations. By determining the full range of size estimates from the models, we thus constrain the maximum possible range in observable size estimates.
Figure 2 shows the sizes as a function of the visibility for the two torus models. Each line corresponds to a certain position angle of the simulated observations. The position angle was changed in steps of 10°. Along every line, the projected baseline length changes, leading to different visibilities and hence torus sizes. As a Gaussian brightness distribution is only an approximation of the brightness distribution of the respective torus model, the size estimates calculated according to Eq. (1) yield a range of sizes. If the brightness distribution were a Gaussian, the calculation would – of course – give the same size for all visibilities.
For visibilities V > 0.2, the size estimates increase monotonically for growing visibilities. This means that the brightness distributions of the models have a shallower decrease than a Gaussian brightness distribution. This is especially true for the clumpy torus model. Because the clumps of the torus are distributed with a radial distribution following a power law with an exponent a = −1, the brightness distribution is also similar to a power law, which cannot be closely represented by a Gaussian brightness distribution.
When the torus is observed face-on (i.e. in the Seyfert 1 case, left panels of Fig. 2), the differences between the size estimates for different visibilities is dominated by the dependence on the baseline length, that is on the deviation of the model from a Gaussian brightness distribution. The total uncertainty in the size estimate is on the order of 40% for the hydrodynamical model and up to a factor of four for the clumpy torus model. For a torus seen edge-on (Seyfert 2 case, right panels of Fig. 2), the individual curves show a smaller relative increase in the size estimate as the visibility increases, especially for the hydrodynamical model. For this model, this means that the brightness distribution of the source is actually quite close to a Gaussian brightness distribution. For small visibilities, V < 0.2, no unambiguous size can be estimated from the visibilities, the reason being that these visibilities are strongly affected by small-scale structures, such as the inner rim of the torus or the clumps in the dust distribution. These structures lead to oscillations in the visibility function, i.e. second and higher order lobes, so that the simplifying approximation by a Gaussian brightness distribution is no longer applicable1.
In the Seyfert 1 case, no significant dependence of the size estimate on the position angle of the measurements is present. Because the tori are seen face-on, they produce brightness distributions that are roughly circular symmetric (cf. left column in Fig. 1). Hence, the visibilities depend only insignificantly on the position angle. In the Seyfert 2 case, however, the position angle of the measurements has a large influence on the size estimate (cf. the array of curves in the right panels of Fig. 2). The reason is the significant elongation of the brightness distribution of a torus seen edge-on. In total, this leads to a difference in the size estimates in the interval 0.2 < V < 0.9 of up to a factor of three. For the edge-on case of the hydrodynamical model, most of this difference is due to the intrinsic elongation of the source and not to the approximation of the brightness distribution by a Gaussian profile. With a sufficient number of interferometric measurements at different position angles (three at least), the elongation and orientation of the emission can be determined. A more accurate, deprojected size estimate for the torus can then be derived. In the case of the hydrodynamical model, the uncertainty in the size caused by assuming a Gaussian brightness distribution can then be reduced to a factor of 1.3, relative to the factor of about two for an unknown orientation. Owing to the power-law dependence of the clumpy torus model, the effect is less pronounced in this model and the uncertainty is only reduced from a factor of ~3.4 to ~2.5. In both cases, this uncertainty is lower than in the Seyfert 1 case. Here, we are primarily interested in determining which constraints on the dust distributions can be derived from the simple size estimates alone, without constraining the geometry of the brightness distribution any further through more complex model fitting. We thus consider the differences in the size estimates for different position angles as an uncertainty. The implications of a clearer knowledge of the geometry are discussed in Sect. 4.3.
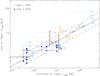 |
Fig. 3 Size of the mid-infrared emitter as a function of its monochromatic luminosity in the mid-infrared for type 1 (light blue) and type 2 (dark blue) AGN. Upper and lower limits on the size estimates are marked by arrows. The fitted relation s = p·L0.5 is delineated by the black continuous line, the scatter in the relation by the dashed lines. The ranges of sizes estimated from the hydrodynamical torus model are plotted in orange, those from the clumpy torus model in dark red. |
The model images used for the calculation represent only one realisation of the distribution of clumps or filaments. Obtaining size estimates at different position angles, however, corresponds to probing different realisations of the fine structure. As can be seen from Fig. 2, the fine structure only becomes relevant for the size estimation at small visibilities, V < 0.2, that is, when individual parts of the substructure are being resolved. This means that the size estimates are independent of any individual realisations of the small-scale structure in the torus.
We conclude that using Eq. (1) is a viable way of estimating the size of the brightness distribution from the visibility. In doing so, the uncertainty in the estimate is on the order of a factor of three for a torus seen edge-on, with a significant part of the uncertainty coming from the elongation of the brightness distribution. The error in the size estimate in the Seyfert 1 case is ≲40% for the hydrodynamical model and up to a factor of four for the clumpy torus model. In this case, the error is dominated by the simplifying assumption of a Gaussian brightness distribution. For the following, the range of sizes derived for 0.2 < V < 0.9 from the models is considered as a measure of the expected accuracy of the sizes estimated.
4. Results and discussion
4.1. Size as a function of the luminosity in the mid-infrared
The sizes of the warm dust distributions as a function of the luminosity in the mid-infrared are shown in Fig. 3. As already found by Tristram et al. (2009), the sizes are consistent with s = p·L0.5 or log (s/pc) = q + 0.5·log (L/W). The larger number of size estimates allows us to redetermine the proportionality factor of this relation. We use the median and the standard deviation of s·L-0.5 for the individual measurements to obtain an estimate for p of p = (1.45 ± 0.20) × 10-18 pc W-0.5. Accordingly, q = −17.84 ± 0.14. When using, instead of the median, the mean of all measurements that are not limits, we obtain p = 1.49 × 10⁻¹⁸ pc W-0.5. In Tristram et al. (2009), a proportionality factor of p = (1.8 ± 0.3) × 10-18 pc W-0.5 was found. The slightly smaller value now, is mainly due to the additional measurements for Mrk 1239 and IC 4329A, which yield comparatively small size estimates for their respective dust distributions. That is these two galaxies seem to possess relatively compact tori in comparison to the other galaxies studied, in particular in comparison to NGC 4151 and NGC 7469. In Tristram et al. (2009), it was shown that the proportionality factor was consistent with a more or less optically thick dust distribution with an average temperature of 300 K. Now a slightly warmer dust distribution with T ~ 330 K is consistent with the measurements.
Because the sizes are plotted as a function of the luminosity at the same wavelength, the figure essentially represents a measure for the compactness of the brightness distribution: any size deviating from the relation implies that the emission is either more compact (size below the relation) or more extended (size above the relation) than the average dust distribution.
The ranges of sizes predicted by the models are shown by the thick bars in Fig. 3. The total fluxes of the models in the mid-infrared were determined simply by integrating over the entire modelled brightness distributions. The sizes from the models are consistent with the observed size estimates, i.e. the torus models at hand roughly produce the correct torus sizes for a given luminosity. We nevertheless assert that the emission of the hydrodynamical model appears to be slightly more extended than expected for the average torus size according to the measured relation. The torus models can however not be used to check whether the relation is correct in itself. It is explicitly assumed that the models scale with L0.5, that is, that they follow the size-luminosity relation in this simple form. Owing to the large amounts of computing time required, the hydrodynamical model has been only calculated for a single luminosity. In addition the clumpy torus model by construction scales as a function of the inner radius of the torus, Rsub (cf. Sect. 3.2). The current measurements are consistent with this assumption and we find no indication that the relative sizes of the nuclear dust distributions change for increasing luminosity other than ∝ L0.5 as might occur in the receding torus paradigm (Lawrence 1991) or is suggested by modelling of high resolution mid-infrared spectra with the clumpy torus model (Hönig et al. 2010).
Both models show a clear and significant offset in the size estimates between the Seyfert 1 and the Seyfert 2 cases. The Seyfert 2 case is shifted towards both a lower luminosity and a greater size with respect to the same torus seen face-on. Quantitatively speaking, a torus seen edge-on produces only about half of the mid-infrared emission from the same torus seen face-on, even though it is at the same time roughly twice as extended. The discrepancy is about the same for both torus models, hence we consider it to be genuine for all similar toroidal dust distributions. The significance of the discrepancy, however, is stronger for the hydrodynamical model, because for this model the uncertainties induced by the assumption of a Gaussian brightness distribution are smaller. This difference in the apparent mid-infrared luminosity of the two orientations of the torus has to be taken into account when evaluating the completeness of mid-infrared selected AGN samples and the statistics of type 1 and type 2 sources in such a sample.
For the same mid-infrared luminosity, a Seyfert 1 torus thus appears about 2.5 times smaller than a Seyfert 2 torus. Its brightness distribution appears more compact, because it is dominated by the bright emission from the hot dust at the inner rim of the torus, i.e. it has a stronger flux concentration towards the centre of the brightness distribution. This is clearly visible when comparing the images in the left (torus face-on) and right columns (torus edge-on) of Fig. 1. Because this difference in size is significant in the sense that it is on the order of or larger than the uncertainty in the size estimates, this should lead to a separation of Seyfert 2 and Seyfert 1 tori into two distinct loci on the size-luminosity relation. More realistically, there is of course a continuous distribution of objects between the face-on and edge-on extremes considered here. That is, there should be a gradient with the object type in the distribution, perpendicular to the direction of the relation. However, the scatter in the currently observed size estimates show that this assumption does not hold in such a simple way. The apparent differences in individual objects are much larger than those of the two classes of objects. With the current data it is thus impossible to ascertain a difference in the compactness of the type 1 and type 2 tori. With smaller errors and a larger sample of sources, the statistics may be improved and a distinction might become possible.
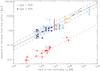 |
Fig. 4 Size of the mid-infrared emitter as a function of the X-ray luminosity, taken as a proxy for the intrinsic AGN luminosity. Colours and symbols are as in Fig. 3. The red dashed line shows the inner radius of the torus derived from reverberation measurements and near-infrared interferometry. The individual measurements of near-infrared radii are plotted as red points and were taken from Suganuma et al. (2006). For these, only the sources common to our sample are labelled. |
The strong differences in the accuracy of size estimates derived by employing a Gaussian approximation for the two different torus models are caused by their different radial brightness distributions. The radial brightness profile of the hydrodynamical model is relatively close to that of a Gaussian profile (especially for the Seyfert 2 case), while that of the clumpy torus model follows a power law. The scatter in the size estimates for a single object from different visibility measurements agrees with the uncertainties derived from the models. Furthermore, lower visibilities yield smaller size estimates. This agrees well with the monotonically increasing sizes for increasing model visibilities found in Sect. 3.3 and indicates that – unsurprisingly – the true brightness distributions deviate from our Gaussian assumption. With more accurate size estimates for different visibility measurements, it will hence be possible to distinguish between different radial brightness profiles: a larger difference between the size estimates at different visibilities will indicate that the radial brightness distribution has power-law dependence, as in the case of the clumpy torus model. A weaker dependence would imply a more Gaussian-like distribution, similar to that of the hydrodynamical torus model. This result will complement methods directly targeted at the investigation of the radial brightness profile of AGN tori, as for example carried out by Kishimoto et al. (2009a). For this, it will, however, be necessary to significantly reduce the error bars in the individual, measured size estimates.
4.2. Size as a function of the estimated intrinsic luminosity
Instead of plotting the size estimates as a function of the luminosity in the mid-infrared, L12 μm, we can also plot the half-size, that is, the mean distance of the dust from the centre r = 0.5·s, as a function of the intrinsic luminosity of the AGN, using the X-ray luminosities as a proxy. This is shown in Fig. 4 and can be considered to be the “true” size-luminosity relation and not only a measure of the compactness of the emission region in the infrared.
The measurements are again consistent with a relation where r ~ L0.5 and we obtain  × 10-18 pc W-0.5 for the corresponding proportionality constant. This is not surprising considering the good correlation between X-ray and mid-infrared luminosities (see Sect. 1). The mid-infrared luminosity itself appears to be a good estimator of the intrinsic AGN luminosity (e.g. Gandhi et al. 2009), although we have shown in the previous section that there is a factor of two difference in the mid-infrared luminosity of a torus seen face- or edge-on. There might be a trend for more luminous sources to have smaller-sized mid-infrared emitters than expected from the size-luminosity relation when considering the limits on the sizes from type 1 sources with higher luminosities, that is IC 4329A, Mrk 1239, and 3C 273. However, this deviation from the relation is insignificant compared to the accuracy of the current data. We note that 3C 273 also has blazar-like properties with the possibility of boosting or excess non-thermal X-ray emission, which may lead to an overestimate of its intrinsic luminosity used here.
The size ranges derived for the two torus models are consistent with the measurements. To plot these models, we simply use LX = LAD, where LAD is the total bolometric luminosity of the heating source used in the models, i.e., the integrated spectrum of the accretion disk. Hence, this confirms that the X-ray fluxes we use are closely related to the intrinsic luminosities of the AGN, assuming that the models are of course correct. Because the amount of unprocessed energy is now relevant, both the Seyfert 1 and Seyfert 2 cases are located at the same luminosity for both models (leading to overlap of the two bars indicating the size ranges for the clumpy torus model).
We also indicate – with the red dashed line – the inner radius of the dust distributions as determined from reverberation measurements in the K band of several type 1 AGN (Suganuma et al. 2006). To be able to display that relation in the same plot, we have to correct their V band luminosities to our hard X-ray luminosities. We adopt an empirical value of L14−195 keV/LV = 3, so that the three objects present in both samples (NGC 7469, NGC 3783, and NGC 4151) have about the same luminosity. The correction factor also agrees reasonably well with values that can be derived by combining the bolometric correction factors given in Elvis et al. (1994), Marconi et al. (2004), and Rigby et al. (2009). Furthermore, this correction factor is also consistent with size measurements made of the inner rim of the torus using K band interferometry from Kishimoto et al. (2011), when taking into account their correction of LUV/LV = 6. The K band emission is thought to originate from dust at or close to the sublimation temperature, that is, from the inner rim of the torus.
We can thus compare the size-luminosity relations for the inner rim (K band) as well as for the body of the torus (mid-infrared) to investigate the structure of the torus. We find that the dust responsible for the mid-infrared emission is located about 30 times further outside than the dust at the sublimation temperature: the warm dust is located at 0.5·s = rbody ~ 30 rin from the centre, where rin is the inner rim of the torus probed by near-infrared reverberation and interferometry. Our value is similar to the value of 25 rin shown in Fig. 1 in Kishimoto et al. (2009a). It should be noted that the sizes referred to here are the apparent sizes of the dust distributions in the infrared, that is, the sizes of the hot and the warm dust. There may well be significant amounts of cooler dust at larger radii, which are invisible in the near- and mid-infrared.
The determined ratio of the size in the mid-infrared to the near-infrared is an additional constraint of AGN torus models. However, it cannot directly be used to pin down a certain torus characteristic, as it depends on many physical parameters, such as the radial dust density distribution, the global geometrical properties, or the clumpiness of the torus. Systematic parameter studies with radiative transfer models of AGN tori are needed to assess this problem and maybe break the aforementioned degeneracy.
4.3. Size estimates depending on the position angle
The differences in size caused by the elongation of the brightness distribution for an edge-on torus were considered as an additional source of uncertainty in the size estimates. By this means, the analysis of the interferometric data was kept very simple. As noted in Sect. 3.3, the uncertainties in the size estimates can be reduced if measurements at different position angles are obtained. Measurements for at least three different position angles and with similar baseline lengths are needed to unambiguously determine the elongation (and orientation) of the source and hence a deprojected size of the dust distribution. For this, at least an ellipse has to be fitted to the sizes at different position angles, if a full two-dimensional model fit to the visibility data is not carried out. The similar baseline lengths for the measurements at different position angles are important to minimise the influence of the size dependence on the visibility, that is caused by the Gaussian approximation. With only two perpendicular measurements, the exact orientation and elongation will remain unknown, although one can obtain a mean size of the torus at this baseline length by using the mean of the two measurements.
The reduced uncertainties in the size estimates will only lead to a small improvement in the distinction between type 1 and type 2 tori in the size luminosity relation. On the other hand, the presence of an elongation in the dust distribution alone is a strong discriminator between face-on and inclined dust tori, as the face-on tori are expected to show no elongation. A more detailed study of the elongation properties of the dust distributions will provide strong constraints on torus models in itself, but is beyond the scope of this paper.
5. Conclusions
We have carried out a more detailed investigation of the size-luminosity relation of the warm dust distributions in AGN than the initial study presented in Tristram et al. (2009) by adding new measurements and comparing the relation to predictions from hydrodynamical and radiative transfer models of dusty tori in AGN. The sizes were estimated directly from the visibilities V assuming a Gaussian brightness distribution and ignoring any position angle dependence of the size estimates. The main goal was to ascertain the degree to which such size estimates can be used to investigate the properties of the nuclear dust distributions in AGN.
By calculating the sizes from modelled images of AGN tori, we found that this method yields viable size estimates with an uncertainty of up to a factor of four, as long as 0.2 ≲ V ≲ 0.9. The uncertainties in the estimated sizes when using this method is dominated by the simplifying assumption of a Gaussian brightness distribution as well as the elongation of the emission region for edge-on tori. Despite their uncertainties, the sizes derived using this simple method can be used for the investigation of the torus properties and for a comparison with model predictions.
The sizes derived from images of two different AGN torus models agree with those determined from the interferometric measurements. According to the models, there should, however, be an offset between the sizes of face-on and edge-on tori: face-on tori should be significantly more compact at the same luminosity, leading to sizes smaller by a factor of about 2.5 than for edge-on tori. This offset is currently not observed but may well be hidden in the current uncertainties and small number statistics of the sizes measured interferometrically to date. In the present sample, differences between individual objects are larger than between the two classes of objects and it remains an open question of whether this observed large scatter is intrinsic, i.e. due to different tori, or to the uncertainty in the current measurements. Measurements of a large sample of AGN with higher accuracies than the current data will be needed to more tightly constrain the relation. These measurements will be provided soon by the data from our MIDI AGN Large Programme, which also includes the determination of accurate total flux spectra using VISIR spectroscopy.
Finally, we have compared the ratio of the sizes in the mid- to the near-infrared, which probe the body and the inner rim of the torus, respectively. The resulting value of approximately 30 can be used to investigate the torus structure, e.g. its geometry and/or its radial density distribution.
The mid-infrared size-luminosity relation agrees closely with other AGN scaling relations, such as those for the torus inner radius,  (e.g. Suganuma et al. 2006; Kishimoto et al. 2011), or the size of the broad line region,
  (e.g. Netzer 1990; or Bentz et al. 2009), with rBLR < rin. This is additional evidence that the AGN phenomenon scales with the luminosity of the central engine.
The value of the lower limit to the visibility for an unambiguous size estimate depends on the strength of the substructure in the torus brightness distribution. One has to ensure that the visibilities used for the size estimate are those from the first lobe of the visibility function. For the torus models analysed here, this is the case for V > 0.2, which is also consistent with the limit used in Tristram et al. (2009).
Acknowledgments
We thank the anonymous referee for his careful reading of the manuscript and his valuable suggestions that lead to a significant improvement of the paper. We especially thank S. F. Hönig for providing images of his clumpy torus model that were used to obtain the size estimates for his model as well as W. Jaffe, the PI of programme 381.B-0240. We also thank L. Burtscher, M. Kishimoto, K. Meisenheimer, and J.-U. Pott for clarifying discussions and helpful suggestions. This research has made use of the SIMBAD database, operated at CDS, Strasbourg, France.
References
- Absil, O., Bakker, E. J., Schoeller, M., & Gondoin, P. A. 2004, in Society of Photo-Optical Instrumentation Engineers (SPIE) Conf. Ser. 5491, ed. W. A. Traub, 1320 [Google Scholar]
- Antonucci, R. 1993, ARA&A, 31, 473 [Google Scholar]
- Beckert, T., Driebe, T., Hönig, S. F., & Weigelt, G. 2008, A&A, 486, L17 [NASA ADS] [CrossRef] [EDP Sciences] [Google Scholar]
- Bentz, M. C., Peterson, B. M., Netzer, H., Pogge, R. W., & Vestergaard, M. 2009, ApJ, 697, 160 [Google Scholar]
- Burtscher, L., Jaffe, W., Raban, D., et al. 2009, ApJ, 705, L53 [NASA ADS] [CrossRef] [Google Scholar]
- Burtscher, L., Meisenheimer, K., Jaffe, W., Tristram, K. R. W., & Röttgering, H. J. A. 2010, PASA, 27, 490 [NASA ADS] [Google Scholar]
- Cusumano, G., La Parola, V., Segreto, A., et al. 2010, A&A, 524, A64 [NASA ADS] [CrossRef] [EDP Sciences] [Google Scholar]
- Elvis, M., Wilkes, B. J., McDowell, J. C., et al. 1994, ApJS, 95, 1 [NASA ADS] [CrossRef] [Google Scholar]
- Gandhi, P., Horst, H., Smette, A., et al. 2009, A&A, 502, 457 [NASA ADS] [CrossRef] [EDP Sciences] [Google Scholar]
- Grupe, D., Mathur, S., & Komossa, S. 2004, AJ, 127, 3161 [NASA ADS] [CrossRef] [Google Scholar]
- Hönig, S. F., & Kishimoto, M. 2010, A&A, 523, A27 [NASA ADS] [CrossRef] [EDP Sciences] [Google Scholar]
- Hönig, S. F., Beckert, T., Ohnaka, K., & Weigelt, G. 2006, A&A, 452, 459 [NASA ADS] [CrossRef] [EDP Sciences] [Google Scholar]
- Hönig, S. F., Kishimoto, M., Gandhi, P., et al. 2010, A&A, 515, A23 [NASA ADS] [CrossRef] [EDP Sciences] [Google Scholar]
- Horst, H., Gandhi, P., Smette, A., & Duschl, W. J. 2008, A&A, 479, 389 [NASA ADS] [CrossRef] [EDP Sciences] [Google Scholar]
- Horst, H., Duschl, W. J., Gandhi, P., & Smette, A. 2009, A&A, 495, 137 [NASA ADS] [CrossRef] [EDP Sciences] [Google Scholar]
- Jaffe, W., Meisenheimer, K., Röttgering, H. J. A., et al. 2004, Nature, 429, 47 [NASA ADS] [CrossRef] [PubMed] [Google Scholar]
- Kishimoto, M., Hönig, S. F., Tristram, K. R. W., & Weigelt, G. 2009a, A&A, 493, L57 [NASA ADS] [CrossRef] [EDP Sciences] [Google Scholar]
- Kishimoto, M., Hönig, S. F., Antonucci, R., et al. 2009b, A&A, 507, L57 [NASA ADS] [CrossRef] [EDP Sciences] [Google Scholar]
- Kishimoto, M., Hönig, S. F., Antonucci, R., et al. 2011, A&A, 527, A121 [CrossRef] [EDP Sciences] [Google Scholar]
- Krolik, J. H., & Begelman, M. C. 1988, ApJ, 329, 702 [NASA ADS] [CrossRef] [Google Scholar]
- Lawrence, A. 1991, MNRAS, 252, 586 [NASA ADS] [Google Scholar]
- Levenson, N. A., Radomski, J. T., Packham, C., et al. 2009, ApJ, 703, 390 [NASA ADS] [CrossRef] [Google Scholar]
- Marconi, A., Risaliti, G., Gilli, R., et al. 2004, MNRAS, 351, 169 [NASA ADS] [CrossRef] [Google Scholar]
- Matt, G., Fabian, A. C., Guainazzi, M., et al. 2000, MNRAS, 318, 173 [NASA ADS] [CrossRef] [Google Scholar]
- Meisenheimer, K., Tristram, K. R. W., Jaffe, W., et al. 2007, A&A, 471, 453 [NASA ADS] [CrossRef] [EDP Sciences] [Google Scholar]
- Nenkova, M., Ivezić, Ž., & Elitzur, M. 2002, ApJ, 570, L9 [NASA ADS] [CrossRef] [Google Scholar]
- Nenkova, M., Sirocky, M. M., Ivezić, Ž., & Elitzur, M. 2008a, ApJ, 685, 147 [NASA ADS] [CrossRef] [Google Scholar]
- Nenkova, M., Sirocky, M. M., Nikutta, R., Ivezić, Ž., & Elitzur, M. 2008b, ApJ, 685, 160 [NASA ADS] [CrossRef] [Google Scholar]
- Netzer, H. 1990, in Active Galactic Nuclei, ed. R. D. Blandford, H. Netzer, L. Woltjer, T. J.-L. Courvoisier, & M. Mayor, 57 [Google Scholar]
- Poncelet, A., Perrin, G., & Sol, H. 2006, A&A, 450, 483 [NASA ADS] [CrossRef] [EDP Sciences] [Google Scholar]
- Pott, J., Malkan, M. A., Elitzur, M., et al. 2010, ApJ, 715, 736 [NASA ADS] [CrossRef] [Google Scholar]
- Raban, D., Jaffe, W., Röttgering, H., Meisenheimer, K., & Tristram, K. R. W. 2009, MNRAS, 394, 1325 [NASA ADS] [CrossRef] [Google Scholar]
- Rigby, J. R., Diamond-Stanic, A. M., & Aniano, G. 2009, ApJ, 700, 1878 [NASA ADS] [CrossRef] [Google Scholar]
- Risaliti, G., Elvis, M., Fabbiano, G., Baldi, A., & Zezas, A. 2005, ApJ, 623, L93 [NASA ADS] [CrossRef] [Google Scholar]
- Schartmann, M., Meisenheimer, K., Camenzind, M., et al. 2008, A&A, 482, 67 [NASA ADS] [CrossRef] [EDP Sciences] [Google Scholar]
- Schartmann, M., Meisenheimer, K., Klahr, H., et al. 2009, MNRAS, 393, 759 [NASA ADS] [CrossRef] [Google Scholar]
- Schartmann, M., Burkert, A., Krause, M., et al. 2010, MNRAS, 403, 1801 [NASA ADS] [CrossRef] [Google Scholar]
- Suganuma, M., Yoshii, Y., Kobayashi, Y., et al. 2006, ApJ, 639, 46 [NASA ADS] [CrossRef] [Google Scholar]
- Swain, M., Vasisht, G., Akeson, R., et al. 2003, ApJ, 596, L163 [NASA ADS] [CrossRef] [Google Scholar]
- Tristram, K. R. W., Meisenheimer, K., Jaffe, W., et al. 2007, A&A, 474, 837 [NASA ADS] [CrossRef] [EDP Sciences] [Google Scholar]
- Tristram, K. R. W., Raban, D., Meisenheimer, K., et al. 2009, A&A, 502, 67 [NASA ADS] [CrossRef] [EDP Sciences] [Google Scholar]
- Tueller, J., Baumgartner, W. H., Markwardt, C. B., et al. 2010, ApJS, 186, 378 [NASA ADS] [CrossRef] [Google Scholar]
- Wittkowski, M., Kervella, P., Arsenault, R., et al. 2004, A&A, 418, L39 [NASA ADS] [CrossRef] [EDP Sciences] [Google Scholar]
All Tables
Galaxy properties and characteristics derived from the interferometric observations of the AGN studied by MIDI.
All Figures
|
Fig. 1 Images of the torus models at 12 μm as used for our size determinations. Top row: full hydrodynamical torus model (Sect. 3.1); bottom row: clumpy torus model (Sect. 3.2); left panels: Seyfert 1 (i = 0°) case; right panels: Seyfert 2 (i = 90°) case. For the example images shown here, a bolometric luminosity of LAD = 4.6 × 1037 W and a distance of D = 45 Mpc were used for both models, in order to reach comparable sizes and intensities. All images are plotted with the same intensity range and a square root colour scale. |
| In the text | |
|
Fig. 2 Estimated physical torus size as a function of the visibility at 12 μm for the two torus models. Top row: full hydrodynamical torus model (Sect. 3.1); bottom row: clumpy torus model (Sect. 3.2); left panels: Seyfert 1 (i = 0°) case; right panels: Seyfert 2 (i = 90°) case. Different lines in the plots correspond to baseline orientations at different position angles. The maximum range of sizes defined by the interval 0.2 < V < 0.9 is marked by the blue lines and dots. The excluded visibilities are shaded in grey. |
| In the text | |
|
Fig. 3 Size of the mid-infrared emitter as a function of its monochromatic luminosity in the mid-infrared for type 1 (light blue) and type 2 (dark blue) AGN. Upper and lower limits on the size estimates are marked by arrows. The fitted relation s = p·L0.5 is delineated by the black continuous line, the scatter in the relation by the dashed lines. The ranges of sizes estimated from the hydrodynamical torus model are plotted in orange, those from the clumpy torus model in dark red. |
| In the text | |
|
Fig. 4 Size of the mid-infrared emitter as a function of the X-ray luminosity, taken as a proxy for the intrinsic AGN luminosity. Colours and symbols are as in Fig. 3. The red dashed line shows the inner radius of the torus derived from reverberation measurements and near-infrared interferometry. The individual measurements of near-infrared radii are plotted as red points and were taken from Suganuma et al. (2006). For these, only the sources common to our sample are labelled. |
| In the text | |
Current usage metrics show cumulative count of Article Views (full-text article views including HTML views, PDF and ePub downloads, according to the available data) and Abstracts Views on Vision4Press platform.
Data correspond to usage on the plateform after 2015. The current usage metrics is available 48-96 hours after online publication and is updated daily on week days.
Initial download of the metrics may take a while.