Fig. 1
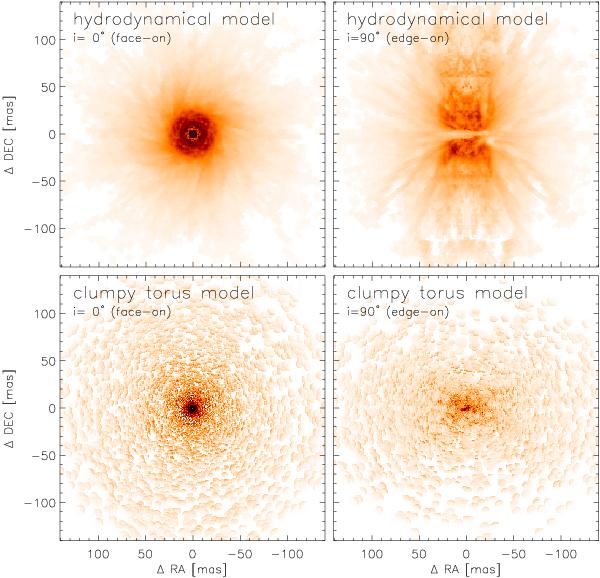
Images of the torus models at 12 μm as used for our size determinations. Top row: full hydrodynamical torus model (Sect. 3.1); bottom row: clumpy torus model (Sect. 3.2); left panels: Seyfert 1 (i = 0°) case; right panels: Seyfert 2 (i = 90°) case. For the example images shown here, a bolometric luminosity of LAD = 4.6 × 1037 W and a distance of D = 45 Mpc were used for both models, in order to reach comparable sizes and intensities. All images are plotted with the same intensity range and a square root colour scale.
Current usage metrics show cumulative count of Article Views (full-text article views including HTML views, PDF and ePub downloads, according to the available data) and Abstracts Views on Vision4Press platform.
Data correspond to usage on the plateform after 2015. The current usage metrics is available 48-96 hours after online publication and is updated daily on week days.
Initial download of the metrics may take a while.